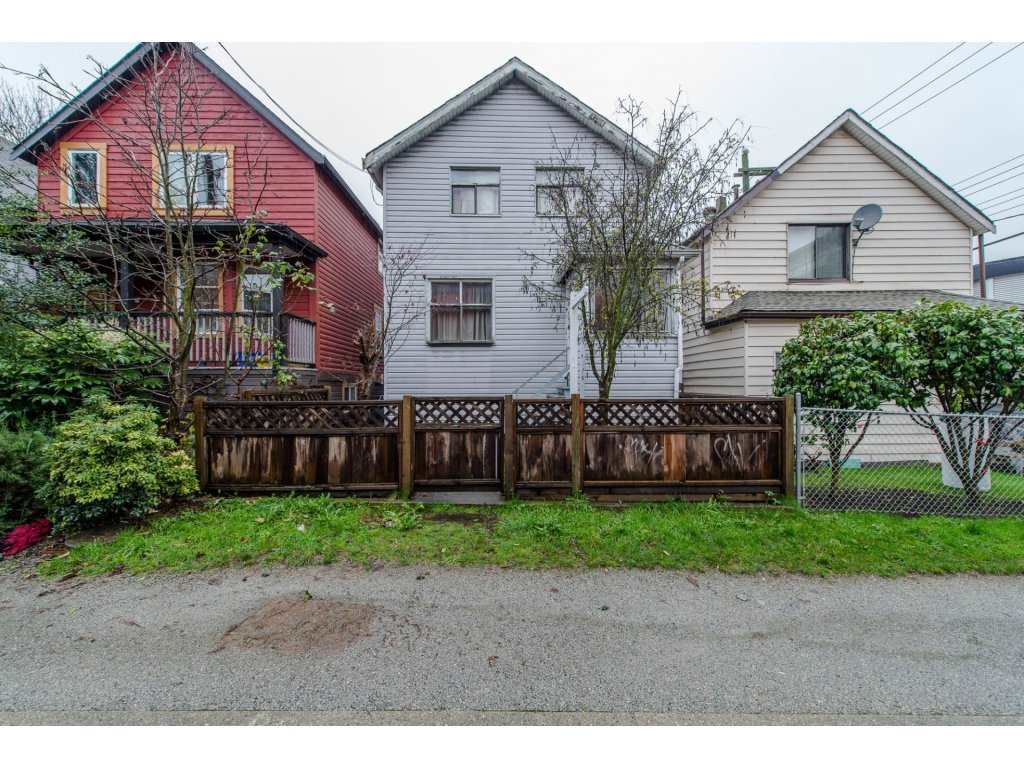
In this market update let’s breakdown Vancouver housing market in December 2016. We will look at both Vancouver East and Vancouver West real estate markets. Let’s only focus on detached resale properties. New construction houses are excluded.
Average Sales Price for Vancouver houses in December 2016 (see graph below)
Vancouver East: $1,447,927 | +4.0% (change since December 2015)
Vancouver West: $3,700,302 | +14.5% (change since December 2015)
Average sales price is up for both Vancouver East and Vancouver West housing markets since December 2015. Although, there is a price drop as compared to the spring and summer of 2016.
Average Percent of Original Price for Vancouver homes in December 2016 (see graph below)
Vancouver East: 91.8% | -11.1% (change since December 2015)
Vancouver West: 93.0% | -8.2% (change since December 2015)
Homes in Vancouver were selling for 6-10% under the original asking price. That’s quite a shift as compared to homes that were selling for 5-10% over the asking price earlier this year.
Toal Inventory of detached houses for sale in Vancouver in December 2016 (see graph below)
Vancouver East: 514 | +108.9% (change since December 2015)
Vancouver West: 365 | -8.1% (change since December 2015)
The inventory of homes is unusually hight for this season, especially in Vancouver East. If high inventory levels are not met by a buyer demand we might see prices go down even farther in 2017.
Total Number of New Listings of homes for Sale in Vancouver in December 2016 (see graph below)
Vancouver East: 85 | -11.5% (change since December 2015)
Vancouver West: 58 | -40.8% (change since December 2015)
Statistically December is a slower month for new listings. This December was no exception.
Number of Vancouver houses sold in December 2016 (see graph below)
Vancouver East: 64 | -42.9% (change since December 2015)
Vancouver West: 61 | -47.9% (change since December 2015)
December is usually the slowest month for real estate transactions. This December was one of the slowest months for real estate transaction in the recent history.
Sales to Active Listings Ratio of Vancouver houses for sale in December 2016 (see graph below)
Vancouver East: 0.125 | -72.5% (change since December 2015)
Vancouver West: 0.167 | -43.4% (change since December 2015)
Based on the sales to active listings ration of detached houses in Vancouver the market remains a “buyers” market.
In conclusion, December 2016 was “slow” month the Vancouver housing market. We continue seeing high inventory levels. Lack of buyer demand and slower nature of December real estate market has caused a slight decrease in the average sales price of homes in Vancouver.
Share this article if you found it useful!
*all data for was take from the Real Estate Board of Greater Vancouver
