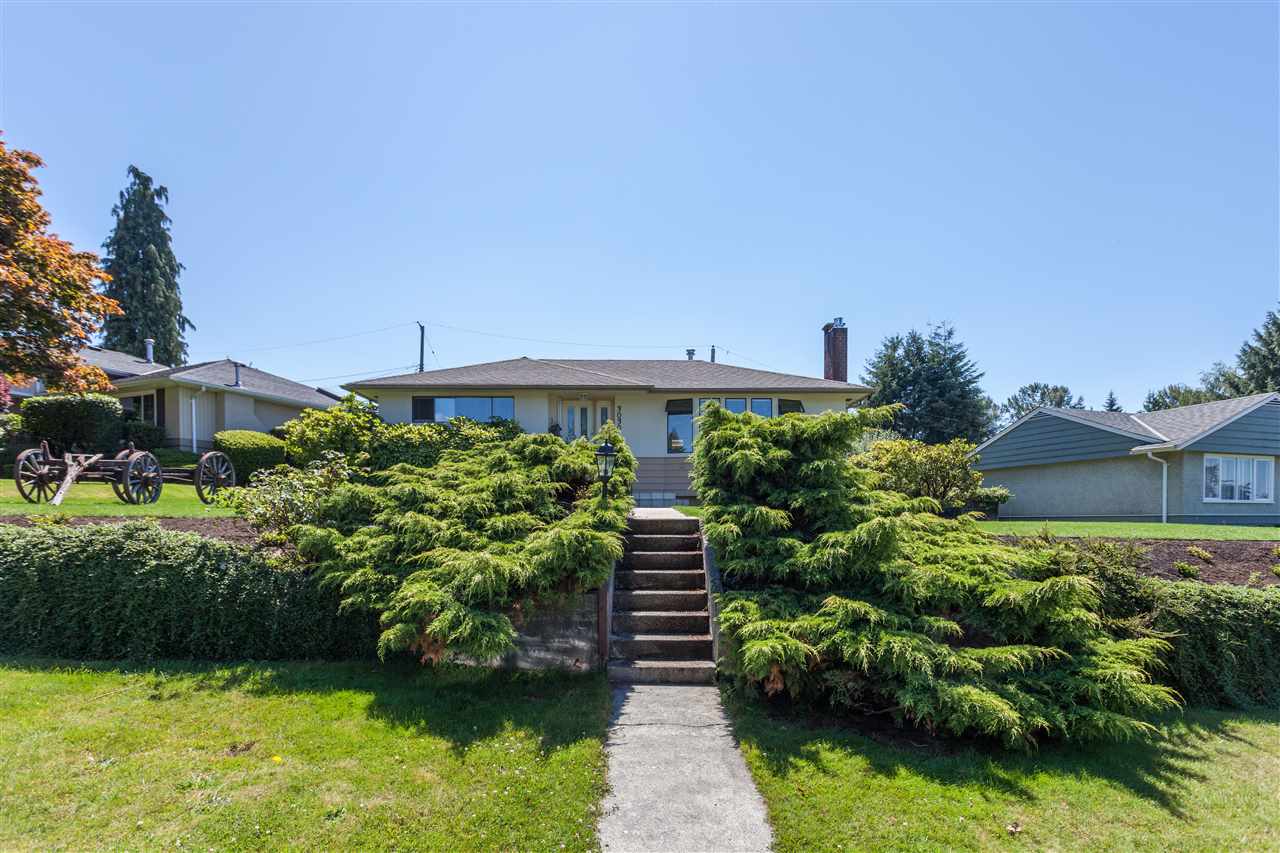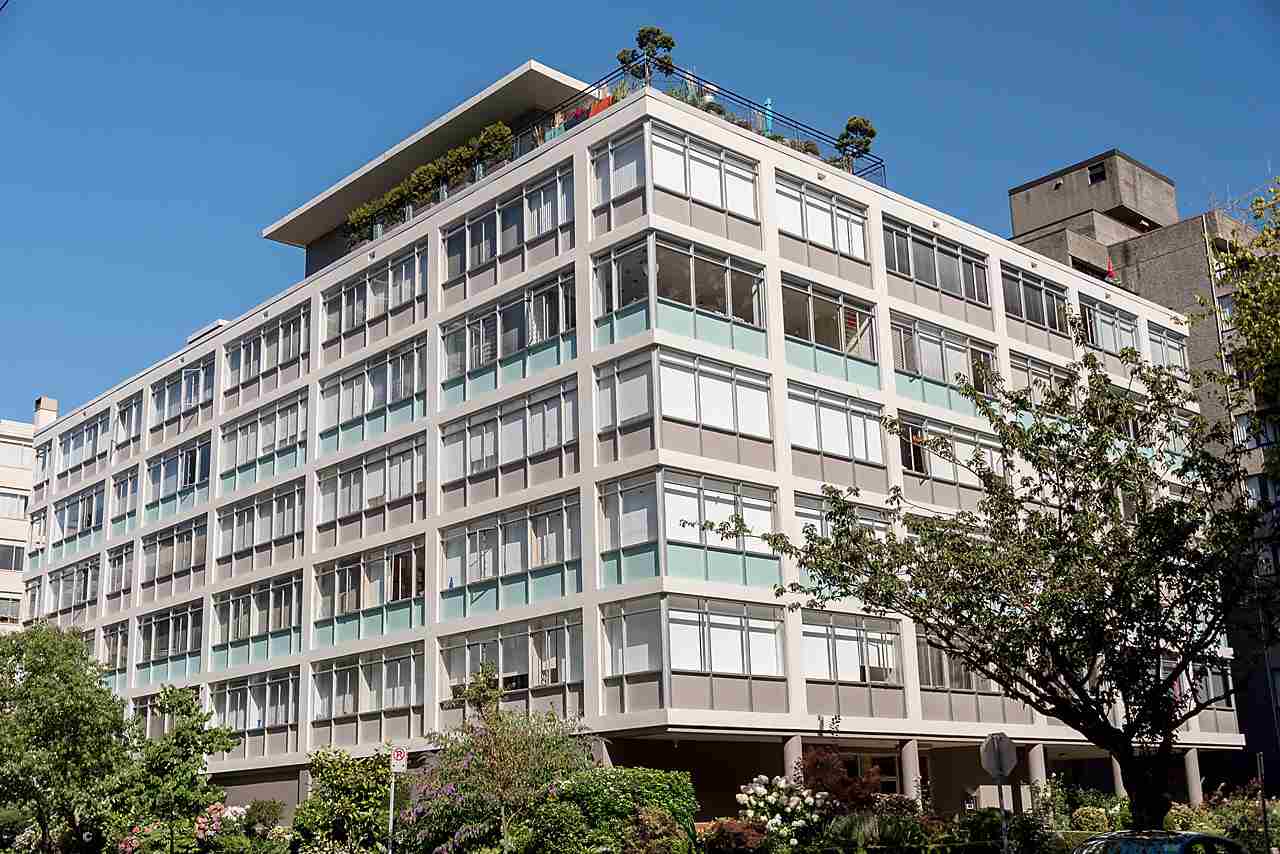
Here is a detailed real estate market breakdown for detached properties. We will look at both East Vancouver and Vancouver Westside. In this real estate update we will concentrate on detached resale properties only. New construction homes as well as townhouses are excluded.
Average Sale Price of detached houses in Vancouver in January 2017 (see graph below)
Vancouver East: $1,393,547 | -7.1% (change since January 2016)
Vancouver West: $3,442,782 | -9.3% (change since January 2016)
The average sales price of detached properties has been declining since early fall of 2016. However, January 2017 was the first month that the average sales price is lower than a year prior. Both Vancouver East and Vancouver West have lower average sales price as compared to January 2016.
Average Percent of Original Asking Price for the detached houses in Vancouver in January 2017 (see graph below)
Vancouver East: 96.0% | -6.9% (change since January 2016)
Vancouver West: 95.4% | -6.8% (change since January 2016)
Vancouver home sellers in January were selling their houses for 4-6 per cent under the original asking price. It is not unusual for properties to be selling under the asking price.
Total Inventory of detached houses for sale in Vancouver in January 2017 (see graph below)
Vancouver East: 597 | +90.7% (change since January 2016)
Vancouver West: 564 | +13.9% (change since January 2016)
There was more available inventory on the market this January as compared to the past years. Vancouver East has had exceptionally high inventory levels this January.
New Listings of detached houses for sale in Vancouver in January 2017 (see graph below)
Vancouver East: 204 | +1.5% (change since January 2016)
Vancouver West: 287 | -5.9% (change since January 2016)
It is not unusual for January to have lower number of new listings on the market as compared to the rest of the year.
Total Sales of detached houses in Vancouver in January 2017 (see graph below)
Vancouver East: 51 | -46.9% (change since January 2016)
Vancouver West: 36 | -72.5% (change since January 2016)
There were very few sales in January 2017. Some of the lowest sales numbers we’ve seen in a long time.
Sales to Active Listings Ratio of detached houses in Vancouver in January 2017 (see graph below)
Vancouver East: 0.085 | -72.3% (change since January 2016)
Vancouver West: 0.064 | -75.8% (change since January 2016)
Based on sales to active listings ratio Vancouver housing market is a strong buyers market. There is more available inventory than there are active buyers.
In conclusion, the prices have dipped about 8% as compared to January 2016. Vancouver housing market remains a strong buyers market with high inventory levels, especially in East Vancouver.


