Are the interest-free housing loans for first-time buyers a good idea? [OPINION]


On December 15th 2016, Premier Christy Clark unveiled a new loan program for the first-time home buyers. This loan program will lend money to the first-time home buyers who cannot come up with the downpayment. The loan will be interest-free for up to 5 years.

There has been some criticism for this program. The primary criticism is that it will actually make housing more unaffordable. Which is the opposite of its purpose.

From my experience most first-time buyers are looking for 1 bedroom condos. For the most part the 1 bedroom condo market in Greater Vancouver is a ‘seller’s market’. (Read more about: Burnaby 1 bedroom condo market here.)  There is a lot of demand for these “starter” 1 bedroom units but not a lot of supply. By making it easier for the first-time home buyers to get into the real estate market the demand for these units is likely to go up. The increase in the demand will of course lead to the increases in price.

On the other hand, it’s very hard for young people to save up enough money for the downpayment. This program will potentially help many first-time buyers get into the real estate market sooner than they would with out. In most cases buying it’s better than renting. With the low interest rates mortgage payment are almost the same as rent.

In my opinion this program will cause the prices for “starter” condos and townhouses to go up in the long run. What Metro Vancouver but especially the City of Vancouver needs it to green-light more development projects. We need to change zoning bylaws for many of Vancouver areas and start building more strata condo buildings. There is a lot of demand and not a lot of supply. To make Vancouver real estate market more affordable we must increase the inventory.

If you are a first-time buyer thinking of getting into the real estate market in Metro Vancouver I suggest getting started as soon as possible. Don’t wait until the prices of the “starter” units go up thanks for the very program.

New BC Government Downpayment Program for the First-Time Buyers; Here is WHAT you NEED to KNOW


On December 15th 2016 Premier Christy Clark unveiled a new loan program to help first-time home buyers come up with their down payment. This program is designed to make it easier for the first-time home buyers to into the Real Estate Market.

The BC Home Owner Mortgage and Equity (HOME) Partnership program will offer qualifying first-time home buyers loans of up to $37,500, interest and payment free, for up to five years. It’s basically a second mortgage on the property that you don’t have to make any payments on for the first 5 years.

The province will begin accepting applications from qualified first-time buyers on January 16, 2017.

To qualify, buyers must:

1. Be buying their first home

The buyers who previously owned real estate anywhere in the world DO NOT qualify for this program.

2. Obtain a high-ratio, insured first mortgage for at least 80 per cent of the purchase price

The buyers can not have a downpayment on the property larger than 20% of it’s value. They must obtain CMHC insurance.

3. Have a combined gross household income not exceeding $150,000

The buyers who will have their names on the tittle must collectively earn less than $150,000/year.

4. Have saved a down payment amount at least equal to the loan amount

The BC government will only land the buyers 50% of the total downpayment. The other half of the downpayment will have to come from the buyers themselves. In other words first-time buyers will still have to contribute at least 2.5% downpayment.

5. Be a Canadian citizen or permanent resident for at least five years

Foreign buyers will not be eligible to take advantage of this program.

6. Have lived in BC for at least the full year preceding their application

In other words potential buyers will have to have lived in British Columbia for at least 1 year before applying for this program.

The loans will be due in full if the buyer defaults on a payment, ceases to use the home as a principle residence or resells the home.

Key facts:

• The BC government loans will match a home buyer’s contribution to a down payment up to five per cent of the home’s purchase price. 

• The maximum purchase price to qualify for a loan is $750,000 (excluding taxes and fees).

• After five years, buyers can either repay their loan or enter into monthly payments at current interest rates.

• Loans through the program are due after 25 years. The same as standard mortgage. 

“This program will boost sales to first-time home buyers. Without question, they’ll take advantage of it wherever they can,” said Helmut Pastrick, Central 1 Credit Union chief economist.

The province estimates this initiative will help at least 42,000 buyers or households province-wide over the next three years. About half of these buyers will be in the Lower Mainland, according to Pastrick.

Burnaby condo market update. Everything FIRST TIME buyers NEED to KNOW – Dec 2016

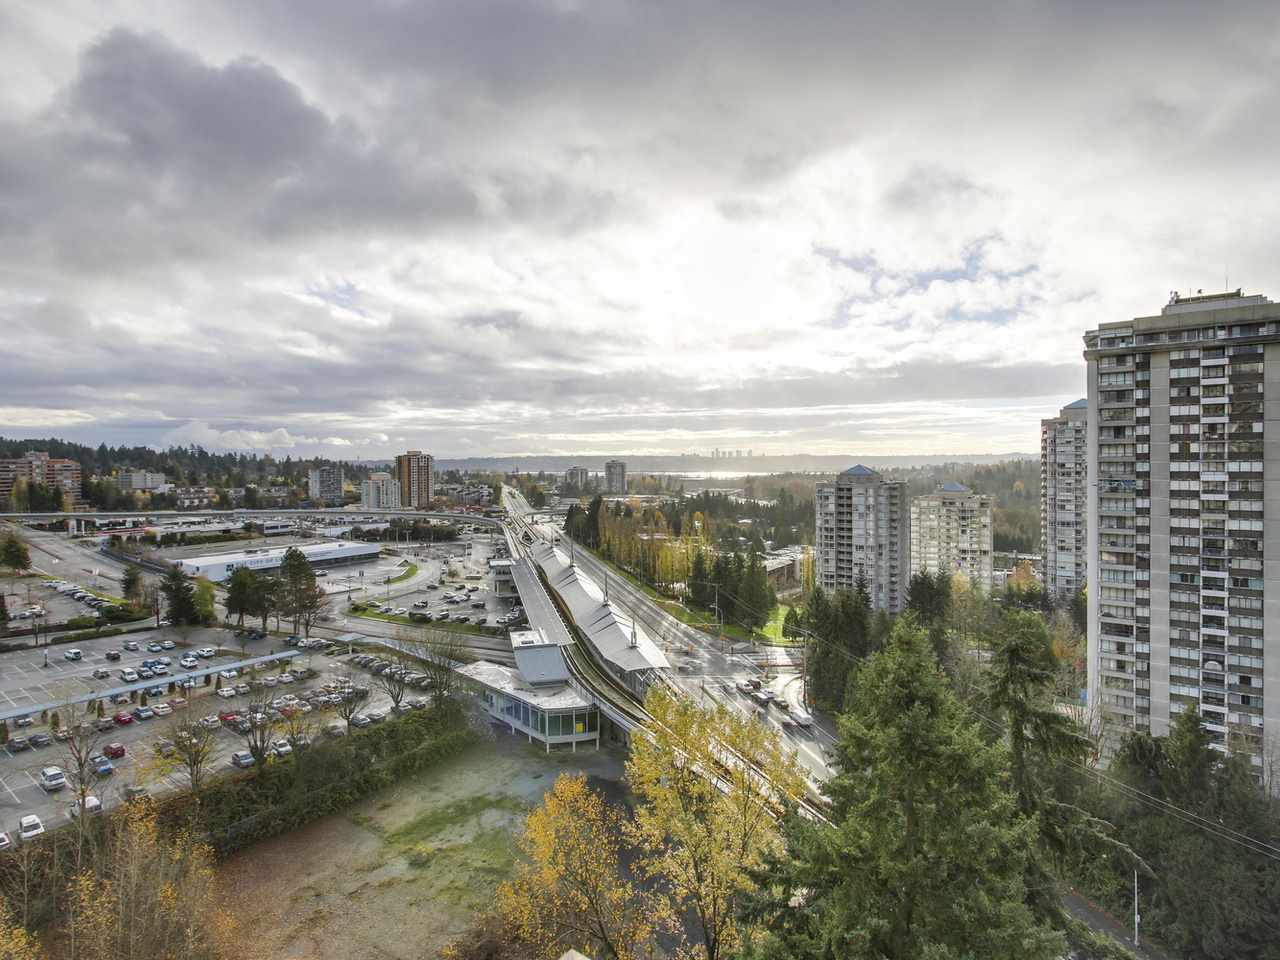
burnaby condos and skytrain view

From my experience, most of the people searching for 1 bedroom condos in Burnaby BC are either first time buyers or investors.  However, you don’t have to be a first time buyer or an investor to find the information in this article useful.

We will breakdown 1 bedroom, resale (no new construction), condo and apartment units in Burnaby BC. Townhouses are not included in these graph and statistics. We will focus on November 2016 and the changes in the real estate trends over the past year. Each graph is from January 2013 to November 2016.

Lets start by looking at Average Sale Price for 1 bedroom condo in Burnaby in November 2016 (see graph below)

Burnaby: $344,681 | +17.6% (change since November 2015)

We see huge market price gains in November 2016 as compared to November 2015. There is a slight dip in prices as compared to Summer 2016. Not a big deal. Slight price variations are expected over the annual cycle of the real estate market.


Next, lets look at Average Percent of Original Price in November 2016 (see graph below)

Burnaby: 99.2% | +2.9% (change since November 2015)

Sellers in Burnaby are still getting almost full asking price for their 1 bedroom condos. 99.2% of the asking price is well above the 10 year average. This tells us that the demand for 1 bedroom condos in Burnaby is high.


Lets talk about Average Price Per Square Foot in November 2016 (see graph below)

Burnaby: $547 | +24.0% (change since November 2015)

The average price per square foot is up quite a bit since November of last year. We see record breaking numbers here.


Now, lets look at the Total Number of 1 Bedroom Condos for Sale in Burnaby in November 2016 (see graph below)

Burnaby: 50 | -71.8% (change since November 2015)

Huge drops in total inventory numbers. In fact it’s the lowest it has been since December 2007. With high buyers’ demand and record low inventory it’s likely for prices to go up even higher.


Lets take a look at the Number of New Listing on the Market next (see graph below)

Burnaby: 33 | -45.0% (change since November 2015)

Big drop in the number of new listings as compared to November 2015. However, it’s not unusual for the number of new listings to be low for this time of year.


Now, lets take a look at the Total Number of 1 Bedroom Condos Sold in November 2016 (see graph below)

Burnaby: 43 | 0.0% (change since November 2015)

We have identical number of sales as we did last November. It is well about the 10 year average for this time of year. Buyers demand for 1 bedroom condos in Burnaby is high.


Lastly, lets have a look at Sales to Active Listings Ratio in November 2016 (see graph below)

Burnaby: 0.860 | +253.9% (change since November 2015)

Huge increase in the sales to active listings ratio since November 2015. Currently Burnaby 1 bedroom condo market is a very strong “sellers” market. 8.6 out of 10 condos were sold this November.

In summery, Burnaby 1 bedroom condo market is a very strong “sellers” market. The inventory levels are very low and the demand is high. We see record breaking prices.

I hope you found this article helpful. If so, please, share it with someone who’s looking for a Burnaby condo or someone who owns a condo in Burnaby and would appreciate the extra info.
Find Burnaby condos for sale here!

*All of the statistics and graphs have been taken from Real Estate Board of Greater Vancouver.

EVERYTHING you NEED to KNOW about Burnaby BC housing market – December 2016

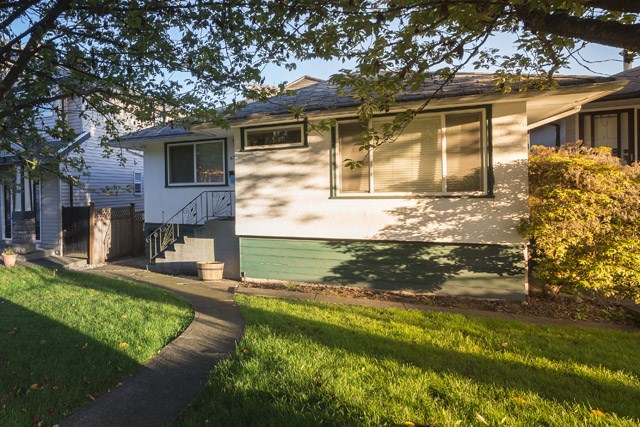
burnaby bc home

Here is a detailed breakdown of the Burnaby detached housing market for November 2016 and for the past 3 years. In this breakdown I will solely focus on detached houses in Burnaby South, Burnaby North and Burnaby East areas. We will only look at the resale properties, brand new construction is not included.

See all houses for sale in Burnaby BC here.

*All of the market statistics and graphs were taken from the Real Estate Board of Greater Vancouver.

Lets start with Average Sales Price of Houses in Burnaby in November 2016 and for the past 3 years (see graph below)

Burnaby: $1,491,466 | +6.9% (change since November 2015)

The sales price is up by almost 7 percent as compared to November 2015. However, we see a significant drop in the sales price as compared to Spring and Summer of 2016. Prices started to dip in August of 2016, right around the time “foreign buyers tax” was introduced.


Next, lets have a look at the Average Percent of Original Price sellers in Burnaby are getting for their houses in November 2016 and for the past 3 years (see graph below)

Burnaby: 94.2% | -7.0% (change since November 2015)

There is a small decline in the percentage of then original price as compared to November of 2015. If we compare current average percent of original price with the average percent of original price in Spring and Summer of 2016 the different is substantial. At the hight of the market this year seller were receiving offers 5-10% over their original asking price.


Next, Total Inventory of Detached Houses for Sale in Burnaby in November 2016 and for the past 3 years (see graph below)

Burnaby: 394 | +60.8% (change since November 2015)

We see substantially more inventory on the market this November as compared to November 2015. However, total inventory for this November is still right around the 10 year average.


Now, lets take a look at the Number of New Listings on the Market in Burnaby BC in November 2016 and for the past 3 years (see graph below)

Burnaby: 82 | -7.9% (change since November 2015)

There are actually fewer new listings on the market this November as compared to November 2015. The number of new listings in November 2016 is around the 10 year average.


Lets take look at Total Number of Sales in Burnaby in November 2016 and for the past 3 years (see graph below)

Burnaby: 48 | -55.1% (change since November 2015)

The total number of sales for November 2016 is less than a half of sales in November 2015. The number of sales for this November is alarmingly low, some of the lowest numbers we’ve seen in the last 10 years. If the sales don’t pick up in 2017 we might have a lot of leftover inventory which might cause prices to dip even more.

Lastly, lets have a look at Sales to Active Listing Ratio for house in Burnaby in November 2016 and for the last 3 years (see graph below)

Burnaby: 0.122 | -72.1% (change since November 2015)

We are currently in a “buyers market”. In November 2015 we had a strong “sellers market”. Real estate market for detached houses has shifted from “sellers market” to “buyers market” in July 2016. The “foreign buyers tax” (introduced in August 2016) has added breaks to the already slowing down market.


The increasing amount of inventory with the lack of buyers’ demand might cause house prices in Burnaby to dip even more in the near future.

I hope you found this article helpful. If so, please, share it with someone who’s looking for a house in Burnaby or someone who owns a Burnaby home and would appreciate the extra information.

EVERYTHING you NEED to KNOW about Vancouver Housing Market – December 2016

vancouver single-family detached home

In this article I’m going to have a detailed breakdown of the Vancouver housing market for November 2016. Both Vancouver East and Vancouver West housing markets will be looked at. We will analyze single-family detached houses, resale houses only (brand new construction is will not be included).

Each graph goes back 3 years, from January 2013 to November 2016.

Find Vancouver houses for sale here.

Let’s start with an Average Sale Price of a detached houses in Vancouver in November 2016 and for the past 3 years (see graph below)

Vancouver East: $1,436,564 | +4.5% (change since November 2015)

Vancouver West: $3,827,771 | +8.0% (change since November 2015)

We can see a clear selling price drop since the record high selling prices in Spring and Summer of 2016. Part of the reason is the newly introduced “foreign investor tax” and part of the reason is a natural decline of the market (as we will see in the later graphs).


Next, let’s take a look at the Average Percent of Original Asking Price sellers got for their detached houses in November 2016 and for the past 3 years (see graph below)

Vancouver East: 94.1% | -9.5% (change since November 2015)

Vancouver West: 92.7% | -7.2% (change since November 2015)

We see a decline in the average precent of original price since November 2015. If we compare November 2016 to Spring and Summer 2016 there is a huge difference in the average percentage of original asking price. In April 2016 home sellers were getting 5-8% over their original asking price.


Now, let’s take a look at Average Number of Days It Takes to Sell a House in Vancouver in November 2016 and for the past 3 years (see graph below)

Vancouver East: 36 | +28.6% (change since November 2015)

Vancouver West: 48 | +2.1% (change since November 2015)

We can see that the average number of days a homes sits on the market went up since November 2015. However, that average is still very reasonable and well within the 10 year average. Right homes are selling relatively quickly.


Next, let’s take a look at the Total Number of Houses for Sale in Vancouver in November 2016 and for the past 3 years (see graph below)

Vancouver East: 701 | +100.3% (change since November 2015)

Vancouver West: 548 | +3.6% (change since November 2015)

East Vancouver has huge increase of total inventory on the market as compared to November 2015. In fact East Vancouver has unusually high number of available houses for sale compared to any month of any season including busy seasons in the Vancouver real estate market.

If the demented doesn’t meet the available inventory, which it doesn’t as we will see in graphs below than we can expect the prices to dip as they have, which we see in the graph above.

Next, let’s take a look at the Total Number of New Listings of Houses for Sale in Vancouver in November 2016 and the last 3 years (see graph below)

Vancouver East: 198 | +35.6% (change since November 2015)

Vancouver West: 111 | -29.3% (change since November 2015)

Again, not the best news for the sellers in East Vancouver as the number of new listings has increased substantially as compared to November 2015. It is very likely that without enough buyers for all of the new listings on the market in East Vancouver, prices will be coming down even more.


Now, lets take a look at the Total Number of Houses Sold in Vancouver in November 2016 and for the last 3 years (see graph below)

Vancouver East: 77 | -43.4% (change since November 2015)

Vancouver West: 65 | -55.8% (change since November 2015)

The number of sales for both Vancouver East and Vancouver West is about half of what they were in November last year.

What’s interesting is that Vancouver housing sales numbers were dropping 2 months before “foreign buyers tax”. The tax added breaks to already slowing down market.


Lastly, lets take a look at the Sales to Active Listings Ratio in November 2016 and for the last 3 years (see graph below)

Vancouver East: 0.110 | -71.7% (change since November 2015)

Vancouver West: 0.119 | -57.2% (change since November 2015)

Both Vancouver East and Vancouver West real estate housing markets are “buyers” markets. We see a shift from the first half of 2016 when the housing market was a strong “sellers” market. The transition into “buyers” market happened around July/August of 2016.

With the increase of inventory, a flood of new listings and low sales figures things are looking a bit grim for the near future of Vancouver housing market.

I hope you found this article helpful. If so, please, share it with someone who’s looking for a house in Vancouver or someone who owns a Vancouver home and would appreciate the extra information.

* All graphs and statistics are taken from the Real Estate Board of Greater Vancouver. 

First time buyers’ breakdown of downtown Vancouver condo market – December 2016

downtown vancouver condo buildings

Here is a detailed breakdown of Downtown Vancouver condo market. Although, it’s not exclusive to the first time buyers, in my opinion first time condo buyers would gain the most from this breakdown, as they are the ones who most often purchase 1 bedroom units.

The information below strictly applies to 1 bedroom and studio condos  (no townhouses). I will analyze four of the Downtown Vancouver neighbourhoods: Coal Harbour, Downtown VW, Yaletown and West End. We will only look at resale units only; brand new units bought directly from the developer are excluded.

All of the statistics and graphs are from the Real Estate Board of Greater Vancouver. I have filtered out brand new development units, townhouses, and 2+ bedroom units. This way you will get bare-bones most accurate representation of the 1 bedroom (and studio) condo market in downtown Vancouver for November 2016 and for the past 3 years.

Find Downtown condos for sale here.

Fist, let’s look at the Average Sale Price of 1 Bedroom Condos in Downtown Vancouver (see graph below)

Coal Harbour: $604,250 | +8.8% (change since November 2015)

Downtown VW: $545,544 | +17.7% (change since November 2015)

Yaletown: $681,091 | +27.6% (change since November 2015)

West End: 487,740 | +17.1% (change since November 2015)

As you can see the prices have really gone up in neighbourhoods like Downtown VW and Yaletown in the last year. There is a huge difference in prices in all four neighbourhoods over the last three years.

West End and Coal Harbour neighbourhoods seem to be going up and down a lot more. That’s because there are fewer units selling in these neighbourhoods and the units that are selling are very diverse. You have buildings that are 40 years old and you have buildings that are 2 years old. So prices (on paper) jump up and down quite a bit. At the end of the days prices are gradually climbing up.


Next, let’s talk about the Percentage of the Listing Price Sellers are Getting for Their Condos (see graph below)

Coal Harbour: 96.8% | -6.1% (change since November 2015)

Downtown VW: 99.8% | -0.5% (change since November 2015)

Yaletown: 97.6% | -2.6% (change since November 2015)

West End: 101.0% | +3.4% (change since November 2015)

Units in the Downtown Vancouver are usually selling very close to the asking price. There is no surprise here. West End condos on average are still selling for over the asking price.

If you look at Spring and Summer 2016 you can really see how “hot” the market really was and how most condos were selling 5-8% over the asking price.


Here is a look at How Quickly the Condos are Selling (see graph below)

Coal Harbour: 33 | +120.0% (change since November 2015)

Downtown VW: 17 | -26.1% (change since November 2015)

Yaletown: 27 | +80.0% (change since November 2015)

West End: 16 | -33.3% (change since November 2015)

1 bedroom condos in Downtown Vancouver have always been selling relatively quickly. We can see some slow-down in Yaletown and Coal Harbour neighbourhoods as compared to November 2015. However, this time last year the market was quite “hot” in these neighbourhoods. “Business as usual” in the all four neighbourhoods.


Price per Square Foot is next (see graph below) 

Coal Harbour: $960 | +12.3% (change since November 2015)

Downtown VW: $907 | +24.1% (change since November 2015)

Yaletown: $986 | +31.5% (change since November 2015)

West End: $829 | +25.8% (change since November 2015)

All four neighbourhoods are up quite a bit from the previous year. Yaletown and Coal Harbour being the most expensive neighbourhoods in terms of price per square foot. Once again, we can see steady increase in price over the last 3 years.


Let’s take a look at a Total Number of 1 Bedroom Condos Available for Sale in Downtown Vancouver in November 2016 and for the past 3 years (see graph below) 

Coal Harbour: 19 | 0.0% (change since November 2015)

Downtown VW: 86 | +65.4% (change since November 2015)

Yaletown: 35 | +40.0% (change since November 2015)

West End: 45 | +2.3% (change since November 2015)

Not much change in Coal Harbour and West End neighbourhoods as compared to November 2016. However, there are substantially more condos on the market in Downtown VW and Yaletown.


Here are the Numbers of New Listings in November 2016 and for the past 3 years (see graph below)

Coal Harbour: 6 | -40.0% (change since November 2015)

Downtown VW: 51 | +30.8% (change since November 2015)

Yaletown: 29 | +38.1% (change since November 2015)

West End: 29 | 0.0% (change since November 2015)

We see an increase in the number of new listings in Downtown VW and Yaletown, which could potentially lead to prices flatlining if the demand is not met.


Here is a look at the Total Number of 1 Bedroom Condos Sold in Downtown Vancouver in November 2016 and the past 3 years (see graph below)

Coal Harbour: 4 | -33.3% (change since November 2015)

Downtown VW: 42 | -39.1% (change since November 2015)

Yaletown: 22 | -8.3% (change since November 2015)

West End: 20 | -35.5% (change since November 2015)

Sales are down across the board in all four of the Downtown neighbourhoods as compared to November 2015.

It is also clear the the sales are down as compared to the Spring 2016 and Summer 2016. However, looking back over the past 3 years sales usually dip in November and December.


Lastly, let’s take a look at the Sales vs Active Listings Ratio (see graph below)

Coal Harbour: 0.211 | -33.2% (change since November 2015)

Downtown VW: 0.488 | -63.2% (change since November 2015)

Yaletown: 0.629 | -34.5% (change since November 2015)

West End: 0.444 | -37.0% (change since November 2015)

Even though all four neighbourhoods are experimenting a slow-down as compared to November 2015. Downtown VW, Yaletown and West End are still “seller” markets with Coal Harbour being a “balanced” market.

I’d like to point out crazy “hot” seller market that we experienced Spring and Summer of 2016. In March 2016 Yaletown had 2.10 sales to active listings ratio. Which means 21 out of 10 condos were selling. In other words inventory from previous months as well as new inventory was selling like hot pancakes.

I hope you found this article helpful. If so, please, share it with someone who’s looking for a downtown condo or someone who owns a downtown condo and would appreciate the extra info.