EVERYTHING you NEED to KNOW about Burnaby BC housing market – December 2016

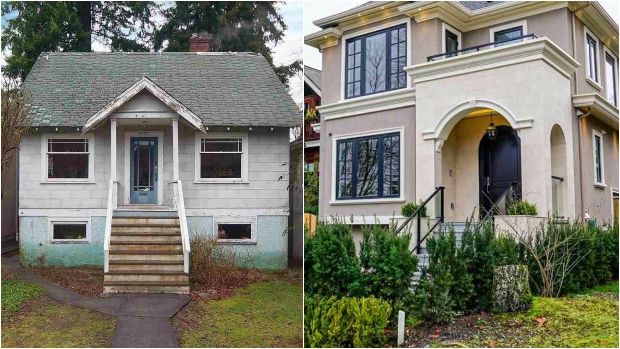
burnaby bc home

Here is a detailed breakdown of the Burnaby detached housing market for November 2016 and for the past 3 years. In this breakdown I will solely focus on detached houses in Burnaby South, Burnaby North and Burnaby East areas. We will only look at the resale properties, brand new construction is not included.

See all houses for sale in Burnaby BC here.

*All of the market statistics and graphs were taken from the Real Estate Board of Greater Vancouver.

Lets start with Average Sales Price of Houses in Burnaby in November 2016 and for the past 3 years (see graph below)

Burnaby: $1,491,466 | +6.9% (change since November 2015)

The sales price is up by almost 7 percent as compared to November 2015. However, we see a significant drop in the sales price as compared to Spring and Summer of 2016. Prices started to dip in August of 2016, right around the time “foreign buyers tax” was introduced.


Next, lets have a look at the Average Percent of Original Price sellers in Burnaby are getting for their houses in November 2016 and for the past 3 years (see graph below)

Burnaby: 94.2% | -7.0% (change since November 2015)

There is a small decline in the percentage of then original price as compared to November of 2015. If we compare current average percent of original price with the average percent of original price in Spring and Summer of 2016 the different is substantial. At the hight of the market this year seller were receiving offers 5-10% over their original asking price.


Next, Total Inventory of Detached Houses for Sale in Burnaby in November 2016 and for the past 3 years (see graph below)

Burnaby: 394 | +60.8% (change since November 2015)

We see substantially more inventory on the market this November as compared to November 2015. However, total inventory for this November is still right around the 10 year average.


Now, lets take a look at the Number of New Listings on the Market in Burnaby BC in November 2016 and for the past 3 years (see graph below)

Burnaby: 82 | -7.9% (change since November 2015)

There are actually fewer new listings on the market this November as compared to November 2015. The number of new listings in November 2016 is around the 10 year average.


Lets take look at Total Number of Sales in Burnaby in November 2016 and for the past 3 years (see graph below)

Burnaby: 48 | -55.1% (change since November 2015)

The total number of sales for November 2016 is less than a half of sales in November 2015. The number of sales for this November is alarmingly low, some of the lowest numbers we’ve seen in the last 10 years. If the sales don’t pick up in 2017 we might have a lot of leftover inventory which might cause prices to dip even more.

Lastly, lets have a look at Sales to Active Listing Ratio for house in Burnaby in November 2016 and for the last 3 years (see graph below)

Burnaby: 0.122 | -72.1% (change since November 2015)

We are currently in a “buyers market”. In November 2015 we had a strong “sellers market”. Real estate market for detached houses has shifted from “sellers market” to “buyers market” in July 2016. The “foreign buyers tax” (introduced in August 2016) has added breaks to the already slowing down market.


The increasing amount of inventory with the lack of buyers’ demand might cause house prices in Burnaby to dip even more in the near future.

I hope you found this article helpful. If so, please, share it with someone who’s looking for a house in Burnaby or someone who owns a Burnaby home and would appreciate the extra information.

EVERYTHING you NEED to KNOW about Vancouver Housing Market – December 2016

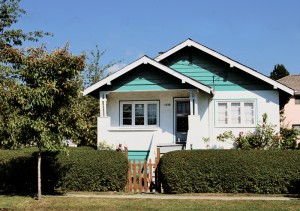
vancouver single-family detached home

In this article I’m going to have a detailed breakdown of the Vancouver housing market for November 2016. Both Vancouver East and Vancouver West housing markets will be looked at. We will analyze single-family detached houses, resale houses only (brand new construction is will not be included).

Each graph goes back 3 years, from January 2013 to November 2016.

Find Vancouver houses for sale here.

Let’s start with an Average Sale Price of a detached houses in Vancouver in November 2016 and for the past 3 years (see graph below)

Vancouver East: $1,436,564 | +4.5% (change since November 2015)

Vancouver West: $3,827,771 | +8.0% (change since November 2015)

We can see a clear selling price drop since the record high selling prices in Spring and Summer of 2016. Part of the reason is the newly introduced “foreign investor tax” and part of the reason is a natural decline of the market (as we will see in the later graphs).


Next, let’s take a look at the Average Percent of Original Asking Price sellers got for their detached houses in November 2016 and for the past 3 years (see graph below)

Vancouver East: 94.1% | -9.5% (change since November 2015)

Vancouver West: 92.7% | -7.2% (change since November 2015)

We see a decline in the average precent of original price since November 2015. If we compare November 2016 to Spring and Summer 2016 there is a huge difference in the average percentage of original asking price. In April 2016 home sellers were getting 5-8% over their original asking price.


Now, let’s take a look at Average Number of Days It Takes to Sell a House in Vancouver in November 2016 and for the past 3 years (see graph below)

Vancouver East: 36 | +28.6% (change since November 2015)

Vancouver West: 48 | +2.1% (change since November 2015)

We can see that the average number of days a homes sits on the market went up since November 2015. However, that average is still very reasonable and well within the 10 year average. Right homes are selling relatively quickly.


Next, let’s take a look at the Total Number of Houses for Sale in Vancouver in November 2016 and for the past 3 years (see graph below)

Vancouver East: 701 | +100.3% (change since November 2015)

Vancouver West: 548 | +3.6% (change since November 2015)

East Vancouver has huge increase of total inventory on the market as compared to November 2015. In fact East Vancouver has unusually high number of available houses for sale compared to any month of any season including busy seasons in the Vancouver real estate market.

If the demented doesn’t meet the available inventory, which it doesn’t as we will see in graphs below than we can expect the prices to dip as they have, which we see in the graph above.

Next, let’s take a look at the Total Number of New Listings of Houses for Sale in Vancouver in November 2016 and the last 3 years (see graph below)

Vancouver East: 198 | +35.6% (change since November 2015)

Vancouver West: 111 | -29.3% (change since November 2015)

Again, not the best news for the sellers in East Vancouver as the number of new listings has increased substantially as compared to November 2015. It is very likely that without enough buyers for all of the new listings on the market in East Vancouver, prices will be coming down even more.


Now, lets take a look at the Total Number of Houses Sold in Vancouver in November 2016 and for the last 3 years (see graph below)

Vancouver East: 77 | -43.4% (change since November 2015)

Vancouver West: 65 | -55.8% (change since November 2015)

The number of sales for both Vancouver East and Vancouver West is about half of what they were in November last year.

What’s interesting is that Vancouver housing sales numbers were dropping 2 months before “foreign buyers tax”. The tax added breaks to already slowing down market.


Lastly, lets take a look at the Sales to Active Listings Ratio in November 2016 and for the last 3 years (see graph below)

Vancouver East: 0.110 | -71.7% (change since November 2015)

Vancouver West: 0.119 | -57.2% (change since November 2015)

Both Vancouver East and Vancouver West real estate housing markets are “buyers” markets. We see a shift from the first half of 2016 when the housing market was a strong “sellers” market. The transition into “buyers” market happened around July/August of 2016.

With the increase of inventory, a flood of new listings and low sales figures things are looking a bit grim for the near future of Vancouver housing market.

I hope you found this article helpful. If so, please, share it with someone who’s looking for a house in Vancouver or someone who owns a Vancouver home and would appreciate the extra information.

* All graphs and statistics are taken from the Real Estate Board of Greater Vancouver. 

First time buyers’ breakdown of downtown Vancouver condo market – December 2016

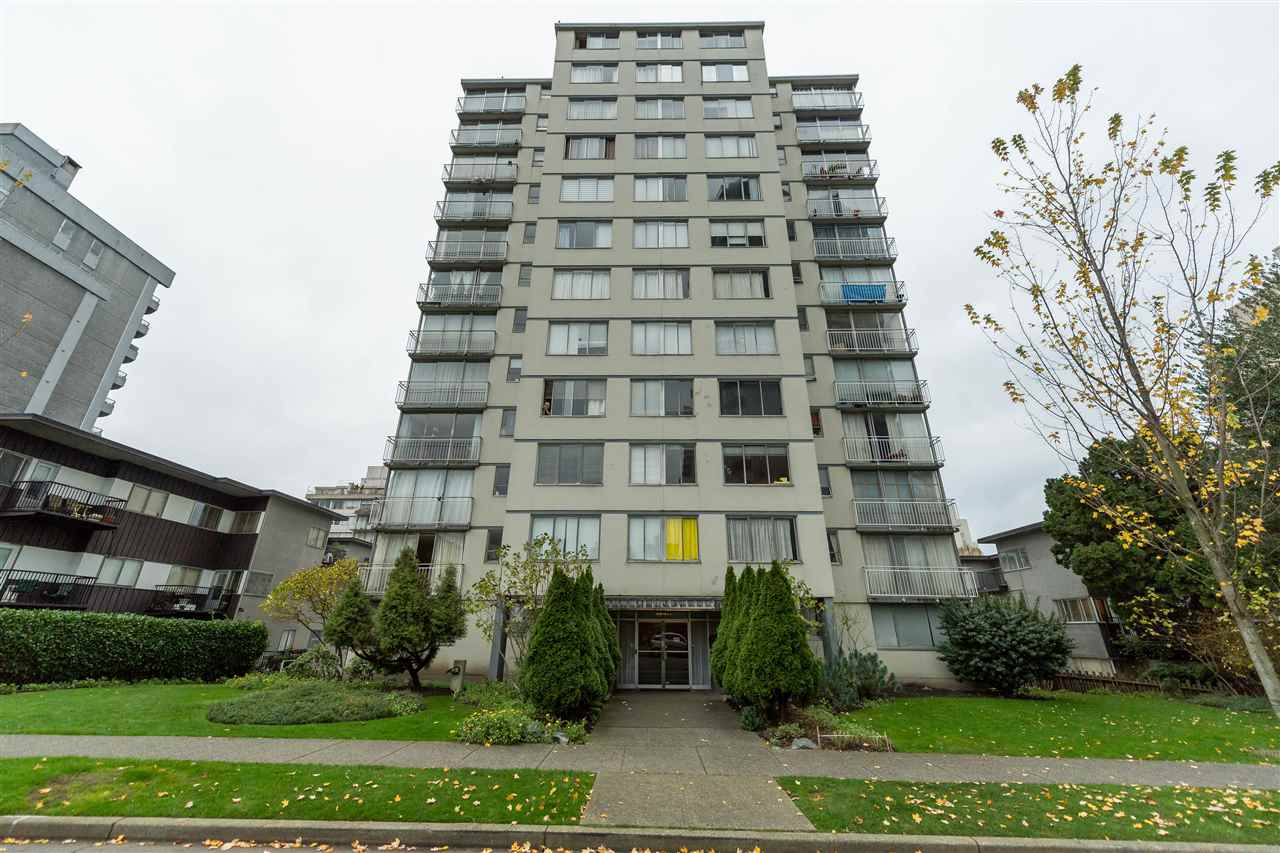
downtown vancouver condo buildings

Here is a detailed breakdown of Downtown Vancouver condo market. Although, it’s not exclusive to the first time buyers, in my opinion first time condo buyers would gain the most from this breakdown, as they are the ones who most often purchase 1 bedroom units.

The information below strictly applies to 1 bedroom and studio condos  (no townhouses). I will analyze four of the Downtown Vancouver neighbourhoods: Coal Harbour, Downtown VW, Yaletown and West End. We will only look at resale units only; brand new units bought directly from the developer are excluded.

All of the statistics and graphs are from the Real Estate Board of Greater Vancouver. I have filtered out brand new development units, townhouses, and 2+ bedroom units. This way you will get bare-bones most accurate representation of the 1 bedroom (and studio) condo market in downtown Vancouver for November 2016 and for the past 3 years.

Find Downtown condos for sale here.

Fist, let’s look at the Average Sale Price of 1 Bedroom Condos in Downtown Vancouver (see graph below)

Coal Harbour: $604,250 | +8.8% (change since November 2015)

Downtown VW: $545,544 | +17.7% (change since November 2015)

Yaletown: $681,091 | +27.6% (change since November 2015)

West End: 487,740 | +17.1% (change since November 2015)

As you can see the prices have really gone up in neighbourhoods like Downtown VW and Yaletown in the last year. There is a huge difference in prices in all four neighbourhoods over the last three years.

West End and Coal Harbour neighbourhoods seem to be going up and down a lot more. That’s because there are fewer units selling in these neighbourhoods and the units that are selling are very diverse. You have buildings that are 40 years old and you have buildings that are 2 years old. So prices (on paper) jump up and down quite a bit. At the end of the days prices are gradually climbing up.


Next, let’s talk about the Percentage of the Listing Price Sellers are Getting for Their Condos (see graph below)

Coal Harbour: 96.8% | -6.1% (change since November 2015)

Downtown VW: 99.8% | -0.5% (change since November 2015)

Yaletown: 97.6% | -2.6% (change since November 2015)

West End: 101.0% | +3.4% (change since November 2015)

Units in the Downtown Vancouver are usually selling very close to the asking price. There is no surprise here. West End condos on average are still selling for over the asking price.

If you look at Spring and Summer 2016 you can really see how “hot” the market really was and how most condos were selling 5-8% over the asking price.


Here is a look at How Quickly the Condos are Selling (see graph below)

Coal Harbour: 33 | +120.0% (change since November 2015)

Downtown VW: 17 | -26.1% (change since November 2015)

Yaletown: 27 | +80.0% (change since November 2015)

West End: 16 | -33.3% (change since November 2015)

1 bedroom condos in Downtown Vancouver have always been selling relatively quickly. We can see some slow-down in Yaletown and Coal Harbour neighbourhoods as compared to November 2015. However, this time last year the market was quite “hot” in these neighbourhoods. “Business as usual” in the all four neighbourhoods.


Price per Square Foot is next (see graph below) 

Coal Harbour: $960 | +12.3% (change since November 2015)

Downtown VW: $907 | +24.1% (change since November 2015)

Yaletown: $986 | +31.5% (change since November 2015)

West End: $829 | +25.8% (change since November 2015)

All four neighbourhoods are up quite a bit from the previous year. Yaletown and Coal Harbour being the most expensive neighbourhoods in terms of price per square foot. Once again, we can see steady increase in price over the last 3 years.


Let’s take a look at a Total Number of 1 Bedroom Condos Available for Sale in Downtown Vancouver in November 2016 and for the past 3 years (see graph below) 

Coal Harbour: 19 | 0.0% (change since November 2015)

Downtown VW: 86 | +65.4% (change since November 2015)

Yaletown: 35 | +40.0% (change since November 2015)

West End: 45 | +2.3% (change since November 2015)

Not much change in Coal Harbour and West End neighbourhoods as compared to November 2016. However, there are substantially more condos on the market in Downtown VW and Yaletown.


Here are the Numbers of New Listings in November 2016 and for the past 3 years (see graph below)

Coal Harbour: 6 | -40.0% (change since November 2015)

Downtown VW: 51 | +30.8% (change since November 2015)

Yaletown: 29 | +38.1% (change since November 2015)

West End: 29 | 0.0% (change since November 2015)

We see an increase in the number of new listings in Downtown VW and Yaletown, which could potentially lead to prices flatlining if the demand is not met.


Here is a look at the Total Number of 1 Bedroom Condos Sold in Downtown Vancouver in November 2016 and the past 3 years (see graph below)

Coal Harbour: 4 | -33.3% (change since November 2015)

Downtown VW: 42 | -39.1% (change since November 2015)

Yaletown: 22 | -8.3% (change since November 2015)

West End: 20 | -35.5% (change since November 2015)

Sales are down across the board in all four of the Downtown neighbourhoods as compared to November 2015.

It is also clear the the sales are down as compared to the Spring 2016 and Summer 2016. However, looking back over the past 3 years sales usually dip in November and December.


Lastly, let’s take a look at the Sales vs Active Listings Ratio (see graph below)

Coal Harbour: 0.211 | -33.2% (change since November 2015)

Downtown VW: 0.488 | -63.2% (change since November 2015)

Yaletown: 0.629 | -34.5% (change since November 2015)

West End: 0.444 | -37.0% (change since November 2015)

Even though all four neighbourhoods are experimenting a slow-down as compared to November 2015. Downtown VW, Yaletown and West End are still “seller” markets with Coal Harbour being a “balanced” market.

I’d like to point out crazy “hot” seller market that we experienced Spring and Summer of 2016. In March 2016 Yaletown had 2.10 sales to active listings ratio. Which means 21 out of 10 condos were selling. In other words inventory from previous months as well as new inventory was selling like hot pancakes.

I hope you found this article helpful. If so, please, share it with someone who’s looking for a downtown condo or someone who owns a downtown condo and would appreciate the extra info.

$2.4 million 86-year-old Point Grey house. Is it worth it?

Last week an 86-year-old “rundown” house was listed for sale. The 4453 W 14th Street house has 2,000 square feet of living space and is located in Point Grey neighbourhood in Vancouver Westside. What’s so special about this property? The price tag of $2,398,000!

This property instantly received a lot of media attention and community outrage. Some online polls even popped up asking people  how much they would pay for this house? “Less than $500,000” is the most popular answer, followed by “you couldn’t pay me to live here” in a second place.

The house is sitting on “standard” Vancouver 33 by 122 plot. 2014 assessment value came in at $1,759,800 almost all of the value is in the land. The house is walking distance to Lord Byng Secondary and Queen Elizabeth Elementary.

So why does it have such a high listing price? 

Clearly, the house itself has little to no value. It’s the land in this prestigious Vancouver neighbourhood that dictates the listing price. 33×122 plot (also know as the Vancouver Special) is not very big. You can build almost 3,000 square foot home with a garage on it.

So is it worth $2.4 million price tag? 

In my opinion it is not. Some real estate professionals will disagree with me on this one. That’s totally fine.

There are many ways to calculate the value of the property. I based my evaluation on compatible currently active properties  on the market as well as the recently sold comparable properties. Also, I looked at the investment value of building a new home in the neighbourhood.

If I were to base my evaluation only on similar properties in the neighbourhood and their selling prices, the price tag of $2.4 million dollars would make sense. If I were a listing agent I would price it at a similar price point. There are a few examples of houses around the same age with the same lot sizes selling for $2.3-$2.4 million dollars in the Point Grey neighbourhood. Which leads me to believe that this house will sell for the asking price or maybe even for more than the asking price.

So why do I say it is not worth the price tag of $2.4 million? 

This house needs to be torn-down and a new house should be build in its place. In the current market, new houses in the neighbourhood (with 33X122 lots) are selling for around $3.1-$3.3 million. It will cost around $650,000-$700,000 to build the new house. If you account for taxes and extra expenses associated with the buying, building and selling process, this house does not make for a very good investment.

I think the buyer of this property is going to be an investor. He or she will justify paying the premium price by betting on future appreciation of the neighbourhood, which is completely fine. More and more real estate developers in Vancouver bet on the future appreciation as land prices in Greater Vancouver continue to rise.

This property could be a good investment if market continues to go up over the next 12 months at the same rate. Any experienced developer will tell you that the investment property has to make sense at the current market value. And NOT solely depend on the future appreciation.

Here is a graph of the real estate prices of detached (resell) houses in Point Grey neighbourhood over the last 5 years.

DISCLAIMER: This article represent my opinion only.  Do your own independent research before making any real estate related decisions.

Property Assessments grew by 16% in 2016

02

Within the next few days owners of more than 500,000 residences in Greater Vancouver will be receiving their 2016 Annual BC Property Assessments in the mail. These assessments will reflect property values as July 1, 2015.

What are property assessments and why are they important? Well, property assessments is an estimated value of your house or a condo by a government agency – BC Assessments. Based on this calculated value the annual property taxes are paid. The higher the BC Assessments value is, the higher annual property taxes are.

There is another important function BC Assessments serve – determining property’s value. Often times when the listing agent tries to determine a listing price of a property he or she will take BC Assessments value into the consideration (not always as each agent has a different way of determining a listing price).  Other times potential buyers will look to BC Assessments or Tax value and try to determine a fair price for a property (that seems not to apply to a current real estate market).

What can owners expect to see this year in their property BC Assessments? Based on the released BC Assessment for this year an increase of 15-20 percent will be typical for a single-family homes in Vancouver, North Vancouver, West Vancouver, Burnaby, Tri-Cities, New Westminster and Squamish (See chart below of a complete breakdown). Don’t be surprised if your home BC Assessments value comes with an increase of 25%.

Overall, Greater Vancouver’s region total assessments increased from $546.7 billion in 2015 to $636.2 billion in 2016. A total increase of about 16% in one year. Almost $8.3 billion of that increase is due to new construction, subdivision and reasoning of properties. Take a drive down Cambie Street and you can witness rezoning of properties working at its finest.

All of this is good news for homeowners who are planning to sell their properties in a near future. However, many homeowners who were not planning to sell this year might be forced to do so because of the high property taxes. At least their properties have gone up in value.

If you are a property owner and need more information or have additional questions you can visit www.bcassessment.ca website for all of that.

Here is an example table showing some of the increases for single-family homes and residential strata units for sample Greater Vancouver communities.

BC Assessments Data for 2016
Image: BC Assessment

What do you think about the increase of BC Assessments? Leave your comments below.

Market statistics for September in Greater Vancouver

rebgvcolour

Metro Vancouver home buyers compete for fewer home listings

Download real estate statistics here – REBGV-Stats-Package-for-Media-revised

The Real Estate Board of Greater Vancouver (REBGV) reports that residential property sales in Metro Vancouver reached 3,345 on the Multiple Listing Service® (MLS®) in September 2015. This represents a 14.5 per cent increase compared to the 2,922 sales recorded in September 2014, and a 0.5 per cent decrease compared to the 3,362 sales in August 2015.

Last month’s sales were 32.9 per cent above the 10-year sales average for the month.

“Residential home sales have been trending at 25 to 30 per cent above the ten-year sales average for most of the year. The number of homes listed for sale hasn’t been keeping up with the demand,” Darcy McLeod, REBGV president said. “It’s this dynamic that’s placing upward pressure on home prices, particularly in the detached home market.”

New listings for detached, attached and apartment properties in Metro Vancouver totalled 4,846 in September. This represents a 7.9 per cent decline compared to the 5,259 new listings reported in September 2014.

The total number of properties listed for sale on the real estate board’s MLS® is 10,805, a 27 per cent decline compared to September 2014 and a 0.8 per cent decline compared to August 2015.

“At no point this year has the number of homes listed for sale exceeded 14,000, which is the first time this has occurred in the region since 2007,” McLeod said.

The MLS® Home Price Index composite benchmark price for all residential properties in Metro Vancouver is currently $722,300. This represents a 13.7 per cent increase compared to September 2014.

The sales-to-active-listings ratio in September was 31 per cent. Generally, analysts say that downward pressure on home prices occurs when the ratio declines below the 12 per cent mark, while home prices often experience upward pressure when it reaches 20 per cent, or higher, in a particular community for a sustained period of time.

Sales of detached properties in September 2015 reached 1,272, an increase of 0.2 per cent from the 1,270 detached sales recorded in September 2014, and a 24.3 per cent increase from the 1,023 units sold in September 2013. The benchmark price for a detached property in Metro Vancouver increased 18.9 per cent from September 2014 to $1,179,700.

Sales of apartment properties reached 1,529 in September 2015, an increase of 28.7 per cent compared to the 1,188 sales in September 2014, and an increase of 50.2 per cent compared to the 1,018 sales in September 2013. The benchmark price of an apartment property increased nine per cent from September 2014 to $415,100.

Attached property sales in September 2015 totalled 544, an increase of 17.2 per cent compared to the 464 sales in September 2014, and a 23.1 per cent increase from the 442 attached properties sold in September 2013. The benchmark price of an attached unit increased 8.1 per cent between September 2014 and 2015 to $518,600.

– Source: http://www.rebgv.org/news-statistics/metro-vancouver-home-buyers-compete-fewer-home-listings#sthash.CSolRqiQ.dpuf