Burnaby condo market update. Everything FIRST TIME buyers NEED to KNOW – Dec 2016

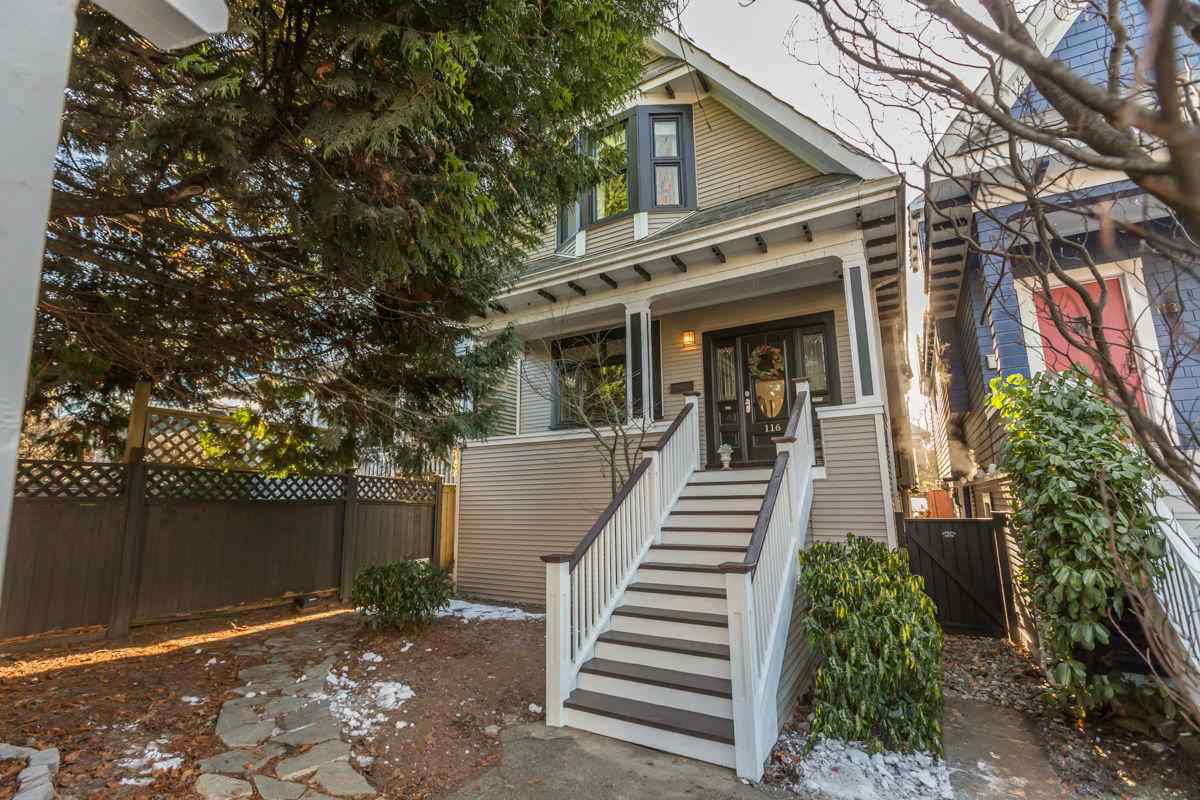
burnaby condos and skytrain view

From my experience, most of the people searching for 1 bedroom condos in Burnaby BC are either first time buyers or investors.  However, you don’t have to be a first time buyer or an investor to find the information in this article useful.

We will breakdown 1 bedroom, resale (no new construction), condo and apartment units in Burnaby BC. Townhouses are not included in these graph and statistics. We will focus on November 2016 and the changes in the real estate trends over the past year. Each graph is from January 2013 to November 2016.

Lets start by looking at Average Sale Price for 1 bedroom condo in Burnaby in November 2016 (see graph below)

Burnaby: $344,681 | +17.6% (change since November 2015)

We see huge market price gains in November 2016 as compared to November 2015. There is a slight dip in prices as compared to Summer 2016. Not a big deal. Slight price variations are expected over the annual cycle of the real estate market.


Next, lets look at Average Percent of Original Price in November 2016 (see graph below)

Burnaby: 99.2% | +2.9% (change since November 2015)

Sellers in Burnaby are still getting almost full asking price for their 1 bedroom condos. 99.2% of the asking price is well above the 10 year average. This tells us that the demand for 1 bedroom condos in Burnaby is high.


Lets talk about Average Price Per Square Foot in November 2016 (see graph below)

Burnaby: $547 | +24.0% (change since November 2015)

The average price per square foot is up quite a bit since November of last year. We see record breaking numbers here.


Now, lets look at the Total Number of 1 Bedroom Condos for Sale in Burnaby in November 2016 (see graph below)

Burnaby: 50 | -71.8% (change since November 2015)

Huge drops in total inventory numbers. In fact it’s the lowest it has been since December 2007. With high buyers’ demand and record low inventory it’s likely for prices to go up even higher.


Lets take a look at the Number of New Listing on the Market next (see graph below)

Burnaby: 33 | -45.0% (change since November 2015)

Big drop in the number of new listings as compared to November 2015. However, it’s not unusual for the number of new listings to be low for this time of year.


Now, lets take a look at the Total Number of 1 Bedroom Condos Sold in November 2016 (see graph below)

Burnaby: 43 | 0.0% (change since November 2015)

We have identical number of sales as we did last November. It is well about the 10 year average for this time of year. Buyers demand for 1 bedroom condos in Burnaby is high.


Lastly, lets have a look at Sales to Active Listings Ratio in November 2016 (see graph below)

Burnaby: 0.860 | +253.9% (change since November 2015)

Huge increase in the sales to active listings ratio since November 2015. Currently Burnaby 1 bedroom condo market is a very strong “sellers” market. 8.6 out of 10 condos were sold this November.

In summery, Burnaby 1 bedroom condo market is a very strong “sellers” market. The inventory levels are very low and the demand is high. We see record breaking prices.

I hope you found this article helpful. If so, please, share it with someone who’s looking for a Burnaby condo or someone who owns a condo in Burnaby and would appreciate the extra info.

Find Burnaby condos for sale here!

*All of the statistics and graphs have been taken from Real Estate Board of Greater Vancouver.

EVERYTHING you NEED to KNOW about Burnaby BC housing market – December 2016

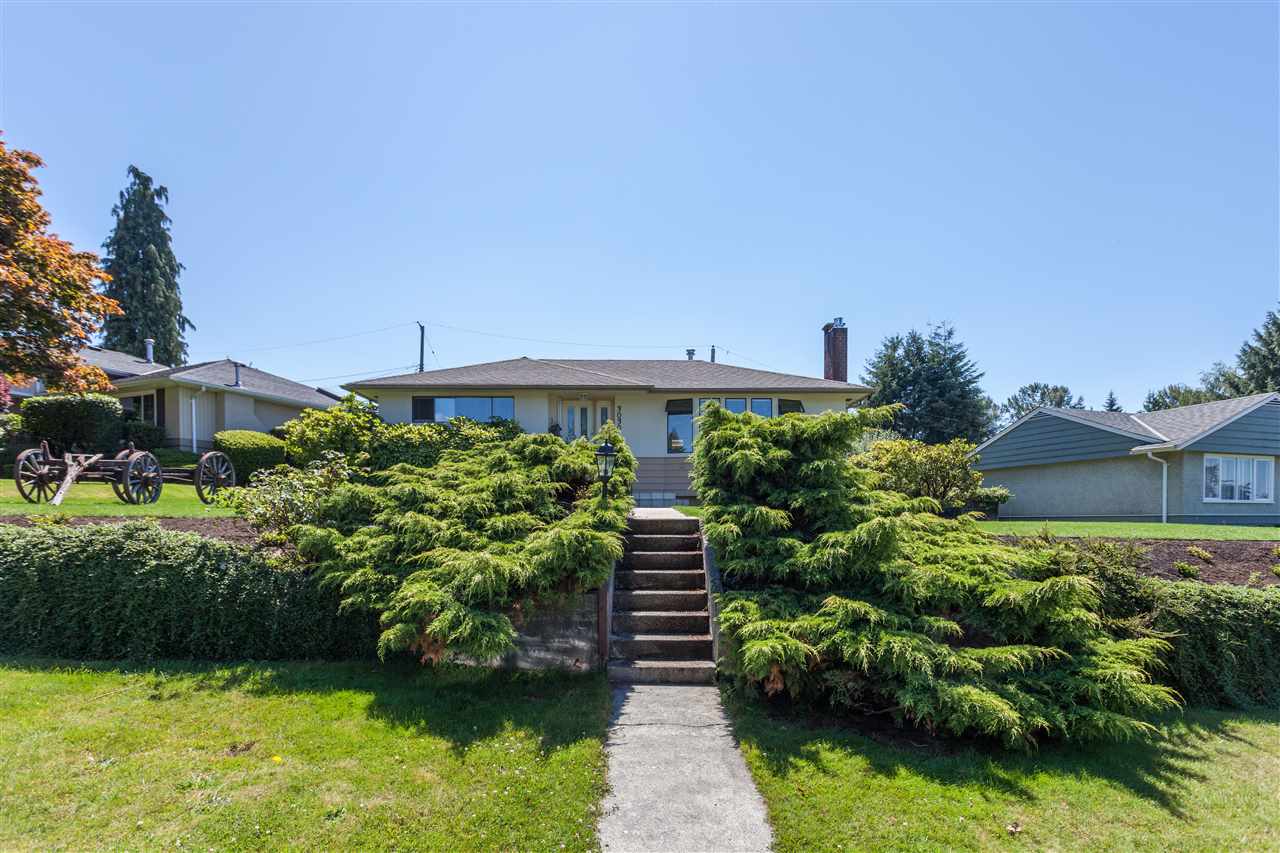
burnaby bc home

Here is a detailed breakdown of the Burnaby detached housing market for November 2016 and for the past 3 years. In this breakdown I will solely focus on detached houses in Burnaby South, Burnaby North and Burnaby East areas. We will only look at the resale properties, brand new construction is not included.

See all houses for sale in Burnaby BC here.

*All of the market statistics and graphs were taken from the Real Estate Board of Greater Vancouver.

Lets start with Average Sales Price of Houses in Burnaby in November 2016 and for the past 3 years (see graph below)

Burnaby: $1,491,466 | +6.9% (change since November 2015)

The sales price is up by almost 7 percent as compared to November 2015. However, we see a significant drop in the sales price as compared to Spring and Summer of 2016. Prices started to dip in August of 2016, right around the time “foreign buyers tax” was introduced.


Next, lets have a look at the Average Percent of Original Price sellers in Burnaby are getting for their houses in November 2016 and for the past 3 years (see graph below)

Burnaby: 94.2% | -7.0% (change since November 2015)

There is a small decline in the percentage of then original price as compared to November of 2015. If we compare current average percent of original price with the average percent of original price in Spring and Summer of 2016 the different is substantial. At the hight of the market this year seller were receiving offers 5-10% over their original asking price.


Next, Total Inventory of Detached Houses for Sale in Burnaby in November 2016 and for the past 3 years (see graph below)

Burnaby: 394 | +60.8% (change since November 2015)

We see substantially more inventory on the market this November as compared to November 2015. However, total inventory for this November is still right around the 10 year average.


Now, lets take a look at the Number of New Listings on the Market in Burnaby BC in November 2016 and for the past 3 years (see graph below)

Burnaby: 82 | -7.9% (change since November 2015)

There are actually fewer new listings on the market this November as compared to November 2015. The number of new listings in November 2016 is around the 10 year average.


Lets take look at Total Number of Sales in Burnaby in November 2016 and for the past 3 years (see graph below)

Burnaby: 48 | -55.1% (change since November 2015)

The total number of sales for November 2016 is less than a half of sales in November 2015. The number of sales for this November is alarmingly low, some of the lowest numbers we’ve seen in the last 10 years. If the sales don’t pick up in 2017 we might have a lot of leftover inventory which might cause prices to dip even more.

Lastly, lets have a look at Sales to Active Listing Ratio for house in Burnaby in November 2016 and for the last 3 years (see graph below)

Burnaby: 0.122 | -72.1% (change since November 2015)

We are currently in a “buyers market”. In November 2015 we had a strong “sellers market”. Real estate market for detached houses has shifted from “sellers market” to “buyers market” in July 2016. The “foreign buyers tax” (introduced in August 2016) has added breaks to the already slowing down market.


The increasing amount of inventory with the lack of buyers’ demand might cause house prices in Burnaby to dip even more in the near future.

I hope you found this article helpful. If so, please, share it with someone who’s looking for a house in Burnaby or someone who owns a Burnaby home and would appreciate the extra information.

EVERYTHING you NEED to KNOW about Vancouver Housing Market – December 2016

vancouver single-family detached home

In this article I’m going to have a detailed breakdown of the Vancouver housing market for November 2016. Both Vancouver East and Vancouver West housing markets will be looked at. We will analyze single-family detached houses, resale houses only (brand new construction is will not be included).

Each graph goes back 3 years, from January 2013 to November 2016.

Find Vancouver houses for sale here.

Let’s start with an Average Sale Price of a detached houses in Vancouver in November 2016 and for the past 3 years (see graph below)

Vancouver East: $1,436,564 | +4.5% (change since November 2015)

Vancouver West: $3,827,771 | +8.0% (change since November 2015)

We can see a clear selling price drop since the record high selling prices in Spring and Summer of 2016. Part of the reason is the newly introduced “foreign investor tax” and part of the reason is a natural decline of the market (as we will see in the later graphs).


Next, let’s take a look at the Average Percent of Original Asking Price sellers got for their detached houses in November 2016 and for the past 3 years (see graph below)

Vancouver East: 94.1% | -9.5% (change since November 2015)

Vancouver West: 92.7% | -7.2% (change since November 2015)

We see a decline in the average precent of original price since November 2015. If we compare November 2016 to Spring and Summer 2016 there is a huge difference in the average percentage of original asking price. In April 2016 home sellers were getting 5-8% over their original asking price.


Now, let’s take a look at Average Number of Days It Takes to Sell a House in Vancouver in November 2016 and for the past 3 years (see graph below)

Vancouver East: 36 | +28.6% (change since November 2015)

Vancouver West: 48 | +2.1% (change since November 2015)

We can see that the average number of days a homes sits on the market went up since November 2015. However, that average is still very reasonable and well within the 10 year average. Right homes are selling relatively quickly.


Next, let’s take a look at the Total Number of Houses for Sale in Vancouver in November 2016 and for the past 3 years (see graph below)

Vancouver East: 701 | +100.3% (change since November 2015)

Vancouver West: 548 | +3.6% (change since November 2015)

East Vancouver has huge increase of total inventory on the market as compared to November 2015. In fact East Vancouver has unusually high number of available houses for sale compared to any month of any season including busy seasons in the Vancouver real estate market.

If the demented doesn’t meet the available inventory, which it doesn’t as we will see in graphs below than we can expect the prices to dip as they have, which we see in the graph above.

Next, let’s take a look at the Total Number of New Listings of Houses for Sale in Vancouver in November 2016 and the last 3 years (see graph below)

Vancouver East: 198 | +35.6% (change since November 2015)

Vancouver West: 111 | -29.3% (change since November 2015)

Again, not the best news for the sellers in East Vancouver as the number of new listings has increased substantially as compared to November 2015. It is very likely that without enough buyers for all of the new listings on the market in East Vancouver, prices will be coming down even more.


Now, lets take a look at the Total Number of Houses Sold in Vancouver in November 2016 and for the last 3 years (see graph below)

Vancouver East: 77 | -43.4% (change since November 2015)

Vancouver West: 65 | -55.8% (change since November 2015)

The number of sales for both Vancouver East and Vancouver West is about half of what they were in November last year.

What’s interesting is that Vancouver housing sales numbers were dropping 2 months before “foreign buyers tax”. The tax added breaks to already slowing down market.


Lastly, lets take a look at the Sales to Active Listings Ratio in November 2016 and for the last 3 years (see graph below)

Vancouver East: 0.110 | -71.7% (change since November 2015)

Vancouver West: 0.119 | -57.2% (change since November 2015)

Both Vancouver East and Vancouver West real estate housing markets are “buyers” markets. We see a shift from the first half of 2016 when the housing market was a strong “sellers” market. The transition into “buyers” market happened around July/August of 2016.

With the increase of inventory, a flood of new listings and low sales figures things are looking a bit grim for the near future of Vancouver housing market.

I hope you found this article helpful. If so, please, share it with someone who’s looking for a house in Vancouver or someone who owns a Vancouver home and would appreciate the extra information.

* All graphs and statistics are taken from the Real Estate Board of Greater Vancouver. 

First time buyers’ breakdown of downtown Vancouver condo market – December 2016

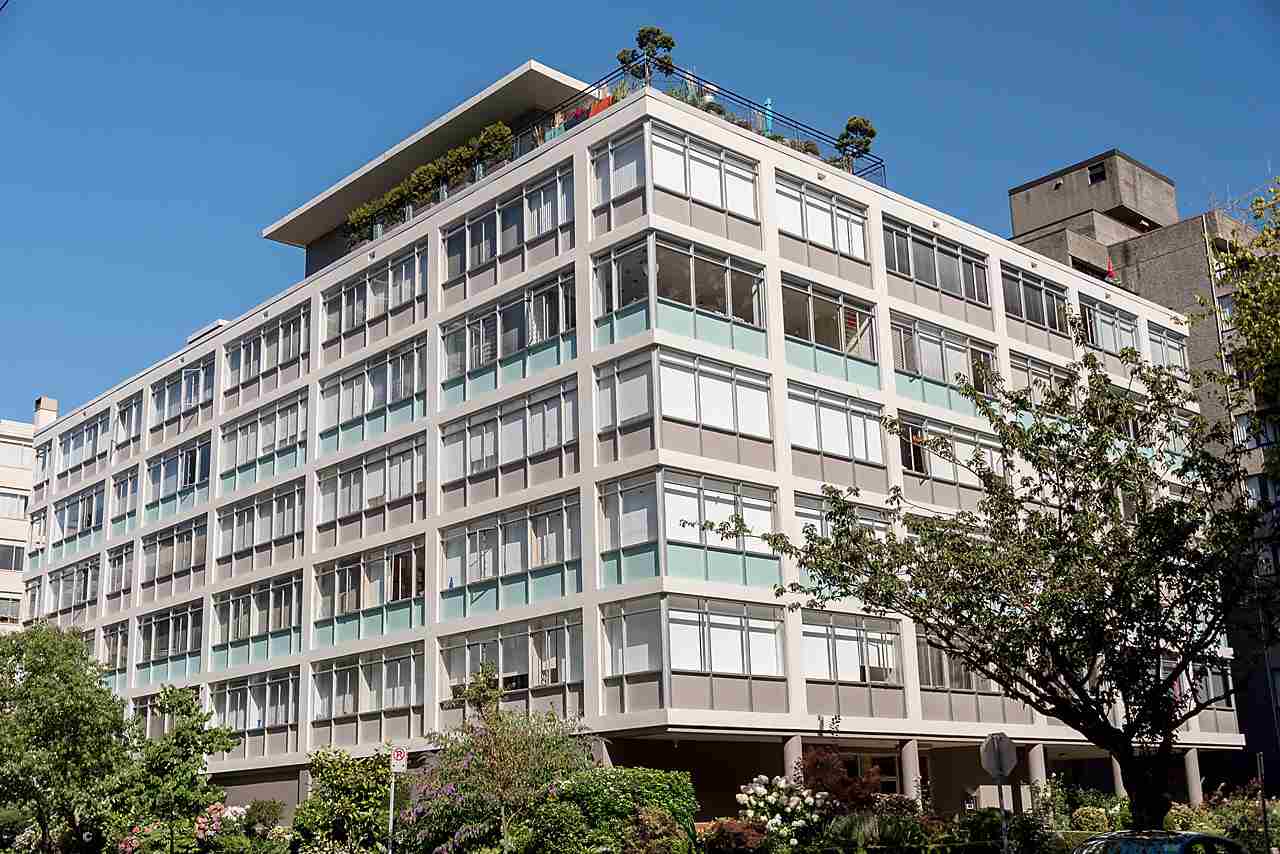
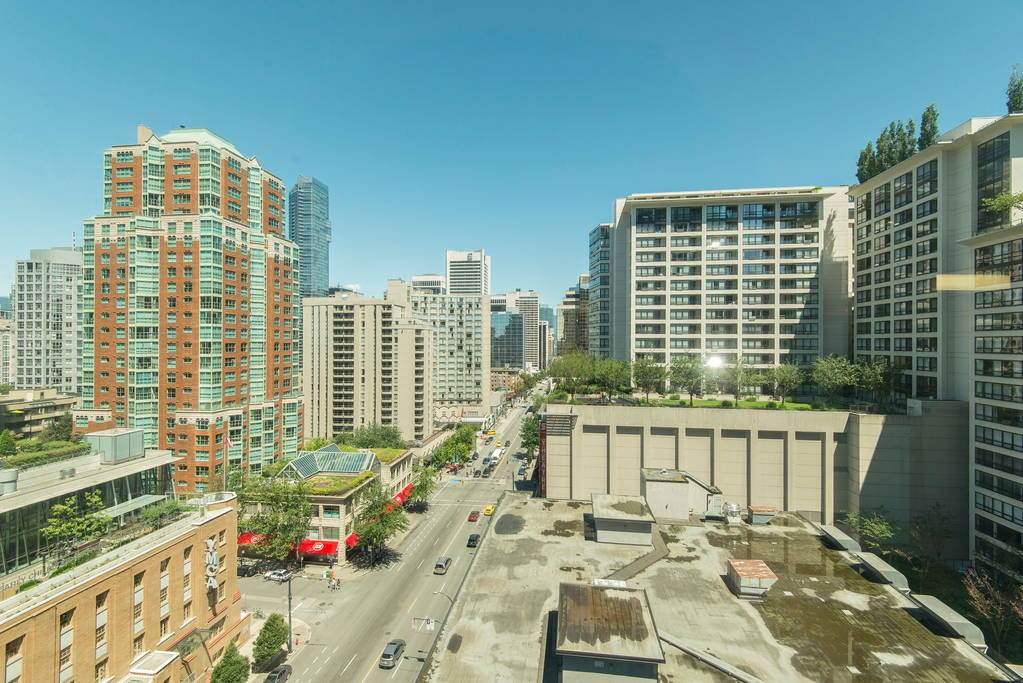
downtown vancouver condo buildings

Here is a detailed breakdown of Downtown Vancouver condo market. Although, it’s not exclusive to the first time buyers, in my opinion first time condo buyers would gain the most from this breakdown, as they are the ones who most often purchase 1 bedroom units.

The information below strictly applies to 1 bedroom and studio condos  (no townhouses). I will analyze four of the Downtown Vancouver neighbourhoods: Coal Harbour, Downtown VW, Yaletown and West End. We will only look at resale units only; brand new units bought directly from the developer are excluded.

All of the statistics and graphs are from the Real Estate Board of Greater Vancouver. I have filtered out brand new development units, townhouses, and 2+ bedroom units. This way you will get bare-bones most accurate representation of the 1 bedroom (and studio) condo market in downtown Vancouver for November 2016 and for the past 3 years.

Find Downtown condos for sale here.

Fist, let’s look at the Average Sale Price of 1 Bedroom Condos in Downtown Vancouver (see graph below)

Coal Harbour: $604,250 | +8.8% (change since November 2015)

Downtown VW: $545,544 | +17.7% (change since November 2015)

Yaletown: $681,091 | +27.6% (change since November 2015)

West End: 487,740 | +17.1% (change since November 2015)

As you can see the prices have really gone up in neighbourhoods like Downtown VW and Yaletown in the last year. There is a huge difference in prices in all four neighbourhoods over the last three years.

West End and Coal Harbour neighbourhoods seem to be going up and down a lot more. That’s because there are fewer units selling in these neighbourhoods and the units that are selling are very diverse. You have buildings that are 40 years old and you have buildings that are 2 years old. So prices (on paper) jump up and down quite a bit. At the end of the days prices are gradually climbing up.


Next, let’s talk about the Percentage of the Listing Price Sellers are Getting for Their Condos (see graph below)

Coal Harbour: 96.8% | -6.1% (change since November 2015)

Downtown VW: 99.8% | -0.5% (change since November 2015)

Yaletown: 97.6% | -2.6% (change since November 2015)

West End: 101.0% | +3.4% (change since November 2015)

Units in the Downtown Vancouver are usually selling very close to the asking price. There is no surprise here. West End condos on average are still selling for over the asking price.

If you look at Spring and Summer 2016 you can really see how “hot” the market really was and how most condos were selling 5-8% over the asking price.


Here is a look at How Quickly the Condos are Selling (see graph below)

Coal Harbour: 33 | +120.0% (change since November 2015)

Downtown VW: 17 | -26.1% (change since November 2015)

Yaletown: 27 | +80.0% (change since November 2015)

West End: 16 | -33.3% (change since November 2015)

1 bedroom condos in Downtown Vancouver have always been selling relatively quickly. We can see some slow-down in Yaletown and Coal Harbour neighbourhoods as compared to November 2015. However, this time last year the market was quite “hot” in these neighbourhoods. “Business as usual” in the all four neighbourhoods.


Price per Square Foot is next (see graph below) 

Coal Harbour: $960 | +12.3% (change since November 2015)

Downtown VW: $907 | +24.1% (change since November 2015)

Yaletown: $986 | +31.5% (change since November 2015)

West End: $829 | +25.8% (change since November 2015)

All four neighbourhoods are up quite a bit from the previous year. Yaletown and Coal Harbour being the most expensive neighbourhoods in terms of price per square foot. Once again, we can see steady increase in price over the last 3 years.


Let’s take a look at a Total Number of 1 Bedroom Condos Available for Sale in Downtown Vancouver in November 2016 and for the past 3 years (see graph below) 

Coal Harbour: 19 | 0.0% (change since November 2015)

Downtown VW: 86 | +65.4% (change since November 2015)

Yaletown: 35 | +40.0% (change since November 2015)

West End: 45 | +2.3% (change since November 2015)

Not much change in Coal Harbour and West End neighbourhoods as compared to November 2016. However, there are substantially more condos on the market in Downtown VW and Yaletown.


Here are the Numbers of New Listings in November 2016 and for the past 3 years (see graph below)

Coal Harbour: 6 | -40.0% (change since November 2015)

Downtown VW: 51 | +30.8% (change since November 2015)

Yaletown: 29 | +38.1% (change since November 2015)

West End: 29 | 0.0% (change since November 2015)

We see an increase in the number of new listings in Downtown VW and Yaletown, which could potentially lead to prices flatlining if the demand is not met.


Here is a look at the Total Number of 1 Bedroom Condos Sold in Downtown Vancouver in November 2016 and the past 3 years (see graph below)

Coal Harbour: 4 | -33.3% (change since November 2015)

Downtown VW: 42 | -39.1% (change since November 2015)

Yaletown: 22 | -8.3% (change since November 2015)

West End: 20 | -35.5% (change since November 2015)

Sales are down across the board in all four of the Downtown neighbourhoods as compared to November 2015.

It is also clear the the sales are down as compared to the Spring 2016 and Summer 2016. However, looking back over the past 3 years sales usually dip in November and December.


Lastly, let’s take a look at the Sales vs Active Listings Ratio (see graph below)

Coal Harbour: 0.211 | -33.2% (change since November 2015)

Downtown VW: 0.488 | -63.2% (change since November 2015)

Yaletown: 0.629 | -34.5% (change since November 2015)

West End: 0.444 | -37.0% (change since November 2015)

Even though all four neighbourhoods are experimenting a slow-down as compared to November 2015. Downtown VW, Yaletown and West End are still “seller” markets with Coal Harbour being a “balanced” market.

I’d like to point out crazy “hot” seller market that we experienced Spring and Summer of 2016. In March 2016 Yaletown had 2.10 sales to active listings ratio. Which means 21 out of 10 condos were selling. In other words inventory from previous months as well as new inventory was selling like hot pancakes.

I hope you found this article helpful. If so, please, share it with someone who’s looking for a downtown condo or someone who owns a downtown condo and would appreciate the extra info.

What effect will “empty home tax” have on Vancouver real estate market?

Vancouver to implement vacancy tax on empty homes and condos

BC government has cleared the way for Vancouver to impose a vacancy tax on empty homes. Vancouver plans to impose the tax by early 2017. It will make it the first major city in Canada to implement such a penalty amid skyrocketing rents and growing concerns about foreign investment and speculation.

Mayor Robertson noted that a city study concluded there were about 10,800 empty residential units homes in the province, almost all condos, as of 2014.

Similar tax was introduced in London on ‘ghost homes’ back in 2013. As a result, one third of absentee owners began renting out their flats. However the majority of absentee owners left their flats vacant. The annual appreciation is way more than the ’empty home tax’.

So what effect will this new tax have on Vancouver’s real estate market?

In my opinion there will be no significant effect. Overseas millionaires and billionaires would not care about a couple of thousands of dollars per year in taxes. Vancouver has one of the lowest property taxes in the world. Even after additional vacancy tax it would still be quite affordable.

Empty home tax would be very hard to enforce. You could always have one of your family members “live” in the unit for a couple of weeks every year.

Other municipalities have not agreed to such tax yet. If Vancouver has an “empty home tax” a potential investor can alway buy in Burnaby, or North Vancouver, or Richmond, or… you get the idea.

In the best case scenario a small portion of the absentee owners will decide to rent out their units. Which should stimulate the rental vacancy rate. Currently the rental vacancy rate in Vancouver is 0.6 percent. Housing experts say a healthy vacancy rate is 3 per cent to 5 per cent.

In summery empty home tax will not have any significant effect on the real estate market in Vancouver. It might have a slight effect on the rental vacancy rates, but even that is questionable.


NOTE: This article represents my personal opinion. Do your own independent research before taking any actions. 

Summer 2016 – Vancouver Real Estate Predictions

What to expect from the Vancouver real estate market for the summer 2016 season.

Vancouver Coal Harbour Marina


Friends, we are entering uncharted waters. The demand is at the all time high. The inventory is the at the all time low. We are having one record-breaking month after another. What’s next? Will the market crash? Will the prices go down? Will the market remain just as strong?

Short answer – “I don’t know”. In fact nobody knows, and whoever claims that they know is probably a psychic. However, as an experienced Vancouver Realtor I can make some predictions.

Real Estate Prices

We can anticipate the prices to go up slightly over the next few months in most of the Vancouver neighbourhoods. The price increase will not be as extreme as what we’ve seen in the winter and spring of 2016.

Condo prices in some Vancouver neighbourhoods might even plateau. In my opinion we will not see any price drops during summer 2016.

Buyers’ Demand

Buyers’ demand in Vancouver remains strong. However, we can already see early signs of the buyers fatigue. Properties that were receiving 8-10 offers in March and April are now getting 3-4 offers. Still a lot of demand. Perhaps people looking for properties during summer months notice a drop in the competition levels.

The market is still a very strong sellers market and will most likely remain a strong sellers markets for the summer months.

Inventory Levels/Houses or Condos for Sale

Vancouver real estate market tends to go through the seasons. Spring is generally a busy season and summer is slower.

We have seen a fifty percent drop in inventory from the previous years.  We can anticipate even lower levels of inventory during this summer season. This could be a good opportunity for potential sellers to list their home as there are less competing properties.

In summery, the Vancouver real estate market will slow down a little for the summer months.  The lower buyer demand will be balanced out by the lower inventory levels. For the most part – business as usual.


NOTE: This article represents my personal opinion. Do your own independent research before taking any actions. 

Spring 2016 – Vancouver Real Estate Market Update

What you should know about the Vancouver real estate market in the spring 2016.

vancouver skyline

Vancouver real estate market is a topic of conversation. It’s hard to turn on the news without hearing about a tear-down that’s been sold for three hundred thousand dollars over asking price or how the last few months were record breaking for local real estate.

Here are the trends I’ve noticed over the last couple of months:

The buyers demand seems to be cooling off as we head into the summer season.

Properties that used to receive 8-10 offers now receive 3-4 offers. Real Estate market activity usually goes though seasonal cycles. There are high activity seasons such as spring and fall, and lower activity seasons such as summer and winter.

A cool-off in real estate activity is natural as we enter summer season. But this could also be an early sign of over-all cool down of the hyper-active Vancouver real estate market. It is still too early to tell which one is it.

The prices are still remaining high and show no signs of going down.

Even though the buyers demand is cooling-off the real estate market still remains a very strong sellers’ market.

Real estate prices continue climbing up but perhaps not as fast as they did at the end of winter/early spring 2016. As we head into the summer season, we can anticipate real estate prices to slow down.  More on this in my article –  “Summer 2016 – Vancouver Real Estate Predictions”.

Inventory is still at the all time low.

We have seen a fifty percent drop in inventory from the previous years. This lack of available properties for sale is one of the most important components fuelling such strong seller market.

We can expect even less inventory being available for the upcoming summer season, which will balance out the lower buyer demand and continue current real estate climate.

In summery, Vancouver real estate market remains a very strong sellers market with roughly 3-4 buyers for every property for sale. Until we solve the demand issue in Vancouver or there is a major change effecting real estate market (ex. increase in the interests rates) we will continue seeing a version of the current market climate for the foreseeable future.


NOTE: This article represents my personal opinion. Do your own independent research before taking any actions. 

One simple way to protect yourself agains “Shadow Flipping” in Vancouver

Turn on the TV or go online and you will see countless news stories about “Shadow Flipping” in Vancouver BC. It is a scary thing for some homeowners. Nobody want’s to have their property flipped for profit before the sale even completes. In some cases the “flipper” can make hundreds of thousands of dollars in a matter of days. So how do you protect yourself from the “shadow flipping” as a seller?

By default every Contract of Purchase and Sale has an “assignment clause” in it. The “assignment clause” is the clause investors abuse to assign/sell contracts for profit. The general rule, in the absence of wording in the contract to the contrary, is that BUYERS MAY ASSIGN their rights under the contract as long as they do not prejudice the rights of the sellers. For example, if the sellers are carrying the mortgage, they may not want the contract to be assigned to another party.

If you are concern about “shadow flipping” and want to protect yourself just add a simple clause in your Contract of Purchase and Sale. This will eliminate the assignment clause and thus eliminate the ability of anyone to assign (or sell) the contract to a third party.

Here is an example of the no assignment option clause:


“No Assignment Option Clause

The Buyer agrees not to assign this contract in whole or in part to any third party.”


That’s it! Now you can sell your property without worrying about anyone trying to flip it before the completion date. Feel free to contact me with questions about selling your property (house or a condo) in the Greater Vancouver area.


DISCLAIMER: Seek independent legal advice before implementing any of the idea discussed in this article.

Will the new mortgage regulations effect Vancouver real estate market? [OPINION]


Quick recap: New Canadian mortgage regulations will now require a minimum down payment of 10% for properties priced over $500,000 (but under $1,000,000).  The new regulations apply to all Canadian mortgages insured by the government. See full article here: link to the article.

The new down payment rules have gotten a lot of people talking. Many experts believe that these changes will have a significant effect on the real estate markets all around Canada.

I am here to offer my opinion on the subject. Keep in mind, it’s my personal opinion based on my experience and should be viewed as such.  I am an expert Metro Vancouver REALTOR®, and can only comment on the local market.

I don’t think that new mortgage regulations will have any significant effect on the Greater Vancouver real estate market.

It is true that a lot of Vancouver properties are priced over $500,000. It is also true that more properties will be reaching that price mark in the near future. In my estimate 90% of all one bedroom condos in downtown Vancouver will cost over $500,000 within the next 5 years.

So why do I say that this rules change will have no significant effect on the local real estate market? In my experience most people buying properties over $500,000 have at least 20-25% down payments. Let me explain…

  • Usually, the buyers of five hundred thousand dollar properties are upsizing from smaller cheaper condos or townhouses. They have gained some equity in their starter home and are ready to move into something larger and more expensive. More often than not, “upsizers” have enough equity in their home for at least 15-20% down payment for the new house.
  • Most first time home buyers will not qualify for a $475,000 mortgage with a 5% down payment. The first time buyers who buy condos or houses over $500,000 have their families help with a portion or the entire amount of a down payment. Most of the time these down payments are well over 10% mark (closer to 20-25%).
  • International buyers and new-comers to Canada will rarely qualify for a mortgage in Canada. And if they do, it’s usually for a special “new-comers to Canada” program. Most of these programs require a minimum of 35% down payment.
  • Of course there are exceptions. Some people will be effected by the change. Young professionals trying to buy their first house or a condo. Families who want to get their starter home. And migrants from other Canadian provinces starting their lives in Vancouver.

From my experience the percentage of the Vancouver buyers that will be effected by this change is very small. This small percentage will not have a substantial impact on the overall Vancouver real estate market.

In my opinion, there will be no real estate crash and no major changes to the market activity in Vancouver. Business as usual! The best advice I can give to someone who is looking to buy their first home or a condo – start saving your money for a down payment today and buy it as soon as you can. The prices are not likely to go down.


DISCLAIMER: I am not a licensed mortgage broker. This article expresses my personal opinion only! Do your own independent research before making any real estate decisions.

3 Tips for selling your home or a condo in a “HOT” Vancouver market

Miniature house with sold sign

Greater Vancouver market continues to be very active late into the fall of 2015. Metro Vancouver has a very strong sellers market, for the most part . That’s great news if you are planning to sell your house or a condo.

To find out if your neighbourhood and a property are in a sellers’ market you can contact me (or your real estate agent) directly or check the statistics here – the latest real estate market statistics for September 2015 from the Greater Vancouver Real Estate Board. If your home is in fact in a “HOT” sellers’ market what is the best way of selling it and making sure that you don’t leave any money on the table?

  1. Price is everything.  One of the main services that your real estate agent provides is figuring out the exact value of your property. To figure out the value (price) of the property recent sales, available inventory and even tax assessments are all taken into account. Every agent has a different strategy to find the value of the property. I will share mine in another blog post. After the value of your property is established; take away 3-5% and that should be your listing price.  Listing your property 3-5% below market value is very important step. This will generate a lot of buyer interest.
  2. “Hold” your property for at least 5-7 days on the market. In a hot sellers’ market you will be receiving offers on the very first day your property is being listed. Accepting an offer on the first or second day of your property being listed is a mistake and will most likely cost you thousands of dollars. It is very important to hold off all offers for at least 5-7 days. This way your property will get appropriate market exposure.  Set a date for the offer presentation. More often than not your will have a bidding war. Buyers will be lining up to present their offers.
  3.  Do Friday showings and an open house on the weekend. There are circumstances where open houses are not an option. For example it’s against the strata bylaws. In these instances regular showings should be scheduled for the weekend.  Assuming you are able to host an open house you should definitely do it.  Friday showings will be mostly for the agents and for the buyers who can’t make it to the open houses on the weekend. The weekend open houses are what really sells the property. If you followed tip #1. You will have people lining up outside of your front door to view the property. More people = urgency = higher offers.

Ideally, you would want to follow this timeline in listing and selling your property for best results in a sellers’ market. Monday or Tuesday your property is live on MLS (with pictures and full description). Make sure that it’s priced 3-5% under the “market value”. No showings throughout the week until Friday. Friday, Saturday and Sunday showings and an open house. Create urgency and drive as many people to the open house as possible. Monday or Tuesday evening offers presentation. Have at least 3 offers and accept the most favorable one. Sounds easy right? The whole process is of course a little bit more complicated but this should give you a pretty good idea.

Make sure to consult with your real estate professional or call me directly 604-565-7052 before implementing any of the steps. Happy selling:)