Vancouver housing market breakdown – Dec 2016

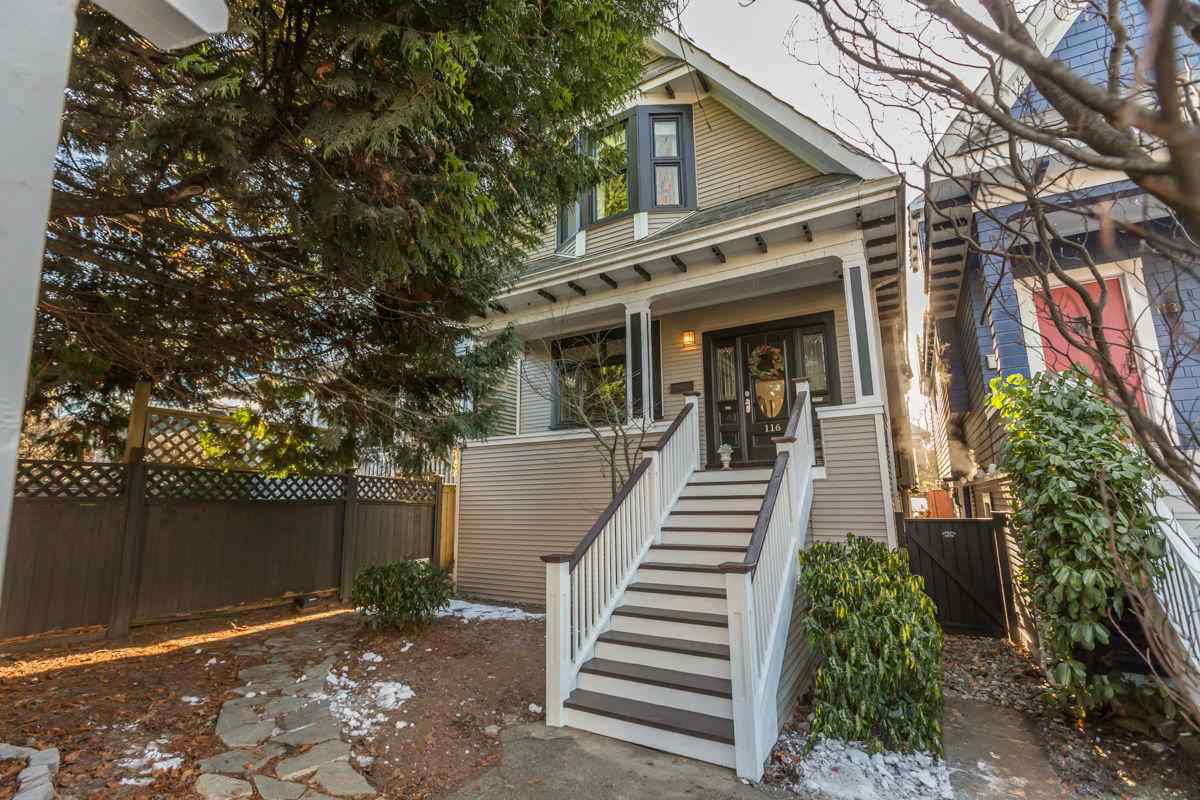
houses in a row

In this market update let’s breakdown Vancouver housing market in December 2016. We will look at both Vancouver East and Vancouver West real estate markets. Let’s only focus on detached resale properties. New construction houses are excluded.

Average Sales Price for Vancouver houses in December 2016 (see graph below)

Vancouver East: $1,447,927 | +4.0% (change since December 2015)

Vancouver West: $3,700,302 | +14.5% (change since December 2015)

Average sales price is up for both Vancouver East and Vancouver West housing markets since December 2015. Although, there is a price drop as compared to the spring and summer of 2016.


Average Percent of Original Price for Vancouver homes in December 2016 (see graph below)

Vancouver East: 91.8% | -11.1% (change since December 2015)

Vancouver West: 93.0% | -8.2% (change since December 2015)

Homes in Vancouver were selling for 6-10% under the original asking price. That’s quite a shift as compared to homes that were selling for 5-10% over the asking price earlier this year.


Toal Inventory of detached houses for sale in Vancouver in December 2016 (see graph below)

Vancouver East: 514 | +108.9% (change since December 2015)

Vancouver West: 365 | -8.1% (change since December 2015)

The inventory of homes is unusually hight for this season, especially in Vancouver East. If high inventory levels are not met by a buyer demand we might see prices go down even farther in 2017.


Total Number of New Listings of homes for Sale in Vancouver in December 2016 (see graph below)

Vancouver East: 85 | -11.5% (change since December 2015)

Vancouver West: 58 | -40.8% (change since December 2015)

Statistically December is a slower month for new listings. This December was no exception.


Number of Vancouver houses sold in December 2016 (see graph below)

Vancouver East: 64 | -42.9% (change since December 2015)

Vancouver West: 61 | -47.9% (change since December 2015)

December is usually the slowest month for real estate transactions. This December was one of the slowest months for real estate transaction in the recent history.

Sales to Active Listings Ratio of Vancouver houses for sale in December 2016 (see graph below)

Vancouver East: 0.125 | -72.5% (change since December 2015)

Vancouver West: 0.167 | -43.4% (change since December 2015)

Based on the sales to active listings ration of detached houses in Vancouver the market remains a “buyers” market.

In conclusion, December 2016 was “slow” month the Vancouver housing market. We continue seeing high inventory levels. Lack of buyer demand and slower nature of December real estate market has caused a slight decrease in the average sales price of homes in Vancouver.

Share this article if you found it useful!

*all data for was take from the Real Estate Board of Greater Vancouver 

DOWNTOWN Vancouver One Bedroom Condo Market Update – Dec 2016

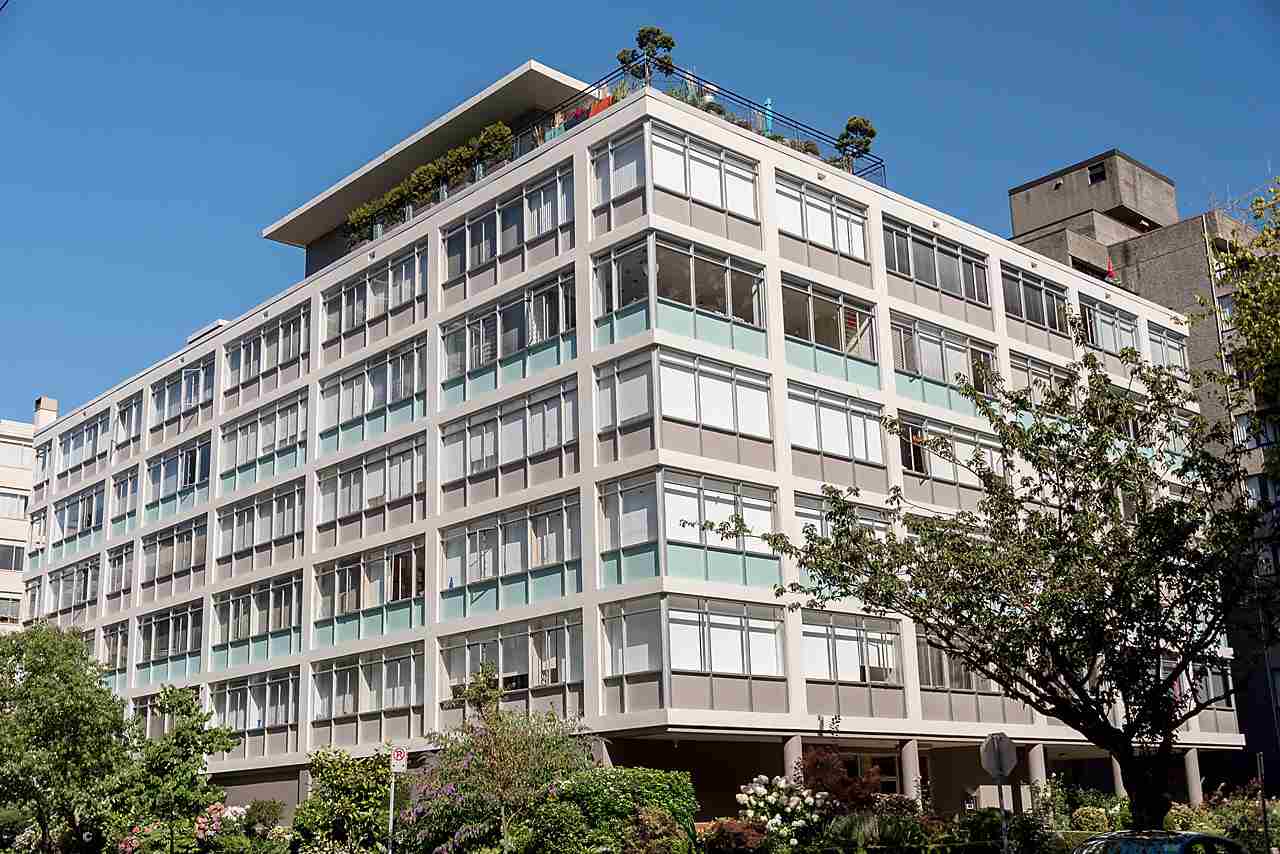
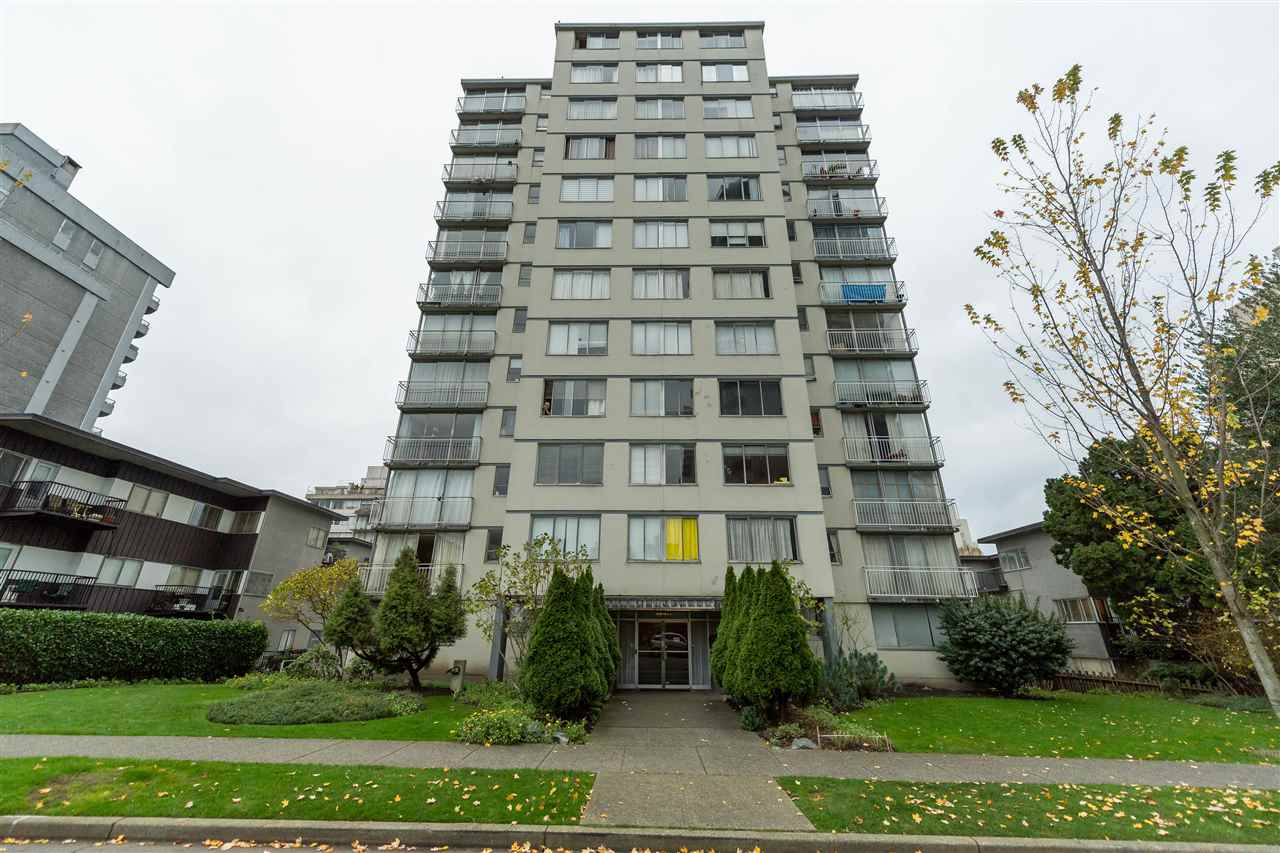
downtown apartment building

Happy New Year, guys! Here is a detailed breakdown and market statistics for one bedroom condo units in downtown Vancouver in December 2016. In this breakdown I will only focus on resale units. No new construction. Statistics include 1 bedroom condo and apartment units.  Two or more bedrooms units are excluded. Townhouses are excluded from this breakdown as well.

Average Sales Price of one bedroom condo units in downtown Vancouver in December 2016 (see graph below)

Coal Harbour: $661,975 | -6.7% (change since December 2015)

Downtown VW: $613,295 | +27.5% (change since December 2015)

Yaletown: $700,052 | +30.1% (change since December 2015)

West End: $460,850 | +10.8% (change since December 2015)

Huge increase in the average sales price in Yaletown and Downtown VW. However, for the first time in a while we see a decline in the average sales price in Coal Harbour. Coal Harbour is almost 7% down as compared to December of last year. It’s too early to tell if the average sales price drop is something serious or just a fluctuation in the market.

Average Percent to Original Price one bedroom condos in downtown Vancouver sold for in December 2016 (see graph below)

Coal Harbour: 96.4% | -5.1% (change since December 2015)

Downtown VW: 98.3% | -2.5% (change since December 2015)

Yaletown: 97.2% | -2.4% (change since December 2015)

West End: 101.1% | +2.2% (change since December 2015)

Nothing surprising here. One bedroom condo and apartment units in downtown Vancouver are usually selling for anywhere between 5-7% under the original asking price. Of course summer and spring of this year was an anomaly; we’ve seen downtown condos selling for 5-8% over the original asking price.


Average Price Per Square Foot for one bedroom condos in downtown Vancouver in December 2016 (see graph below)

Coal Harbour: $1,021 | +10.1% (change since December 2015)

Downtown VW: $932 | +20.9% (change since December 2015)

Yaletown: $1,000 | +20.3% (change since December 2015)

West End: $752 | +6.5% (change since December 2015)

For the fist time average price per square foot in Yaletown has reached a $1000 mark.


Total Inventory of one bedroom condos for sale in downtown Vancouver in December 2016 (see graph below)

Coal Harbour: 8 | -11.1% (change since December 2015)

Downtown VW: 36 | +20.0% (change since December 2015)

Yaletown: 20 | +42.9%(change since December 2015)

West End: 29 | +16.0% (change since December 2015)

We see unusually low inventory numbers of one bedroom condo units on sale in downtown Vancouver. The total inventory numbers are well below the 10 year average.  Strong buyer demand and the lack of inventory could cause the prices to keep increasing in 2017.


New Listings of one bedroom condos for sale in downtown Vancouver in December 2016 (see graph below)

Coal Harbour: 3 | 0.0% (change since December 2015)

Downtown VW: 19 | -29.6% (change since December 2015)

Yaletown: 11 | -8.3% (change since December 2015)

West End: 5 | -58.3% (change since December 2015)

Very low number of new listing on the market this December. Although, it is not unusual for December to be a slow month for the new listings.


Total number of one bedroom condos sold in downtown Vancouver in December 2016 (see graph below)

Coal Harbour: 8 | 0.0% (change since December 2015)

Downtown VW: 40 | +11.1% (change since December 2015)

Yaletown: 17 | -15.0% (change since December 2015)

West End: 14 | -46.2% (change since December 2015)

Most likely due to the low inventory levels, lack of new listings and the slower nature of December real estate market there were fewer sales.


Sales to Active Listings Ration of one bedroom condos in downtown Vancouver in December 2016 (see graph below)

Coal Harbour: 1.000 | +12.5% (change since December 2015)

Downtown VW: 1.111 | -7.4% (change since December 2015)

Yaletown: 0.850 | -40.5% (change since December 2015)

West End: 0.483 | -53.6% (change since December 2015)

Downtown remains a very strong “sellers” market with almost no back inventory.

In conclusion, average sales price for one bedroom condos in downtown is still going up. Record high price per square foot numbers and low inventory levels. It is still very much a “sellers” market although on average units are selling for 4-5% under the original asking price.

Comment below if you found this information useful. 

* all of the statistics used in this breakdown were taken from the Real Estate Board Of Greater Vancouver

Burnaby BC 1 bedroom condo market update – December 2016

burnaby condo building

Happy New Year, guys! In this article I will breakdown one bedroom condo market in Burnaby BC for the month of December 2016. The statistics only apply to condos and apartments in Burnaby (townhouses are excluded). The breakdown is for one bedroom resale condos only. New construction and condos with more than one bedroom are excluded.

Average Sales Price for 1 Bedroom Condo in Burnaby in December 2016 (see graph below)

December 2016: $357,435 | +17.6% (change since December 2015)

November 2016: $344,681

There is a substantial increase in the average sales price for one bedroom condos in Burnaby as compared to December 2015. We also see an increase in the sales prices as compared to last month. It seems that the sales prices are catching up with the sales prices we’ve seen in the summer of this year.


Average Percent of Original Asking Price seller of one bedroom units in Burnaby are getting in December 2016 (see graph below)

December 2016: 97.8% | +0.6% (change since December 2015)

November 2016: 99.2%

In December sellers of one bedroom condos in Burnaby were selling their units for about 2-3% below their original asking price. That’s an indication of a healthy buyer demand.

In the summer and spring of 2016 sellers were selling their units for 5-8% over their original asking price.


Average Price Per Square Foot of one bedroom unit is Burnaby in December 2016 (see graph below)

December 2016: $537 | +20.7% (change since December 2015)

November 2016: $547

A huge increase in the average price per square foot since December of 2015. Again, an indication of a strong buyer demand as the prices don’t seem to be dropping for one bedroom units in Burnaby BC.


Total Inventory of one bedroom condos and apartments in Burnaby in December 2016 (see graph below)

December 2016: 36 | -69.0% (change since December 2015)

November 2016: 53

Record low inventory levels for one bedroom units in Burnaby. In fact this December we’ve had the lowest number of one bedroom condo units for sale in the last 10 years.  Such low inventory levels are likely to cause price increase for one bedroom condos.


Total Number of New Listing of one bedroom condo unit on the market in Burnaby in December 2016 (see graph below)

December 2016: 18 | -41.9% (change since December 2015)

November 2016: 33

Some of the lowest numbers for new listings of one bedroom condos in Burnaby we’ve seen.


Total Number of Sales for one bedroom condos in Burnaby in December 2016 (see graph below)

December 2016: 21 | -60.4% (change since December 2015)

November 2016: 43

Not surprisingly we see a huge drop in the total number of sales as compared to December of 2015. Lack of inventory as well as the natural slow-down in the real estate activity are the likely causes for such low transaction numbers.


Sales to Active Listings Ratio for one bedroom condos in Burnaby in December 2016 (see graph below)

December 2016: 0.583 | +27.6% (change since December 2015)

November 2016: 0.81

The one bedroom condo market in Burnaby is still a very strong “sellers” market. On average 58 out of 100 condos were sold in December 2016.

In conclusion, one bedroom condo market in Burnaby is a “sellers” market. Units are generally selling for very close to their original asking price. Sale prices are gradually increasing. Total inventory levels are at all time low heading into 2017.

Leave a comment below if you found this information useful! 

*all of the data is taken from the Real Estate Board of Greater Vancouver

WHAT you NEED to KNOW about BURNABY housing market – DEC 2016 update

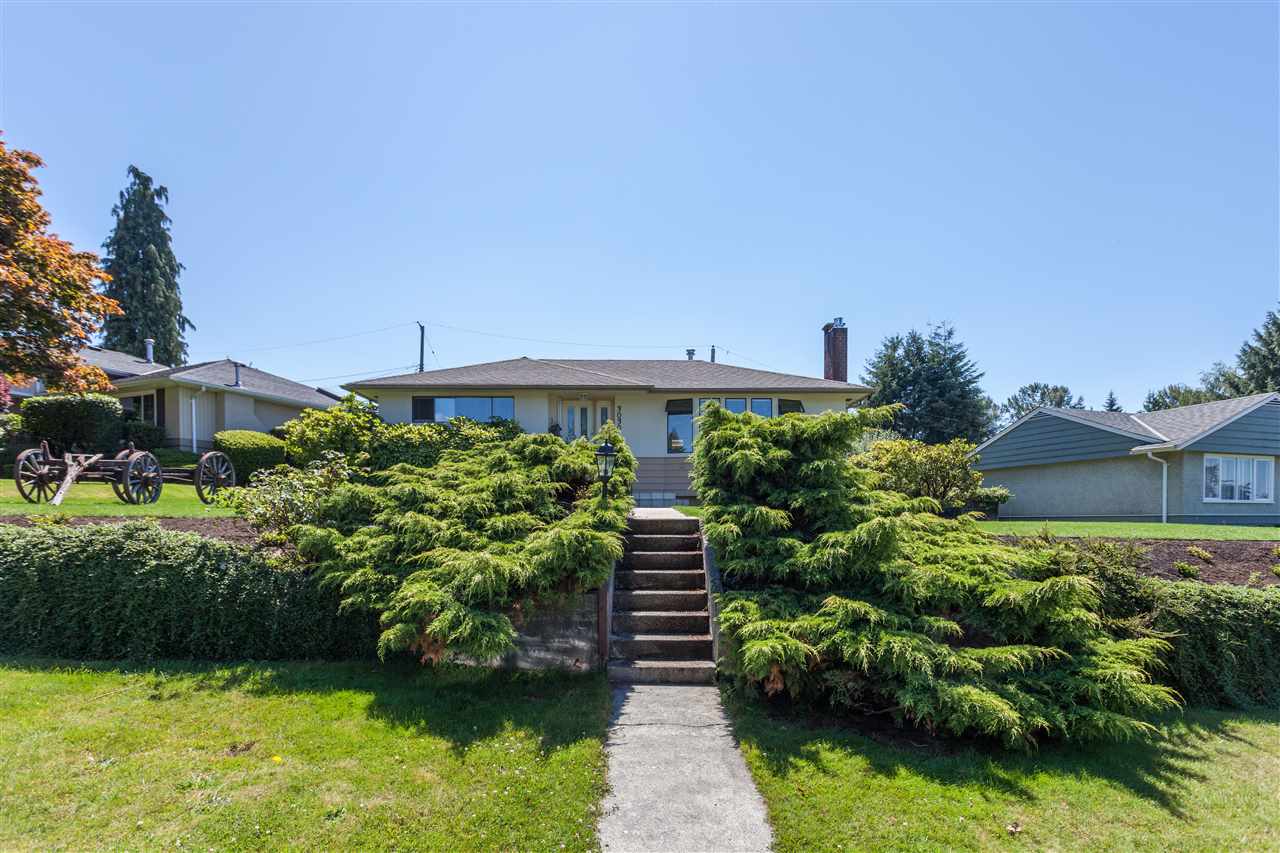
Burnaby house for sale

Happy New Year guys! Here is a detailed breakdown of the housing market in Burnaby BC for December 2016. We will only focus on detached houses. New construction is excluded from this breakdown. Condos and townhouses are also excluded (Burnaby condo breakdown can be found here).

Average Sales Price of Houses in Burnaby in December 2016 (see graph below)

Burnaby, Dec 2016: $1,591,410 | +5.3% (change since December 2015)

November 2016: $1,491,466

We can see the price increase of over 5% as compared to December of last year. The average sales price is also up as compared to last month. This could be a good sign for the sellers heading into 2017.


Average Percent of Original Price sellers in Burnaby are getting for their homes in December 2016 (see graph below)

Burnaby, Dec 2016: 93.5% | -8.8% (change since December 2015)

November 2016: 94.2%

Since the height of the real estate market in the summer and spring of 2016 average percent of original price has been declining. Home sellers are selling their houses 5-7% under their original asking price. We haven’t seen such low numbers since 2013.


Total Inventory of Detached Houses for Sale in Burnaby in December 2016 (see graph below)

Burnaby, Dec 2016: 236 | +41.3% (change since December 2015)

November 2016: 419

There is substantially more inventory on the market as compared to December of 2015. However the inventory levels have dropped significantly as compared to last month. Sellers seemed to be pulling the properties off the market in December.  A large number of these properties will be back on the market at the beginning of 2017.


Number of the New Listings on the market in Burnaby in December 2016 (see graph below)

Burnaby, Dec 2016: 35 | -45.3% (change since December 2015)

November 2016: 82

As can be expected for this season there are very few listings. In December 2016 we had half of the new listings as compared to the December of last year. To be fair, December 2015 was an usually busy year for detached houses in Burnaby.


Total Number of Detached Houses Sold in Burnaby in December 2016 (see graph below)

Burnaby, Dec 2016: 40 | -56.5% (change since December 2015)

November 2016: 48

We see lower than usual number of sales in the last quarter of 2016. Slight decline in sales as compared to November 2016. However, more than a 50% in sales as compared to December of 2015.


Sales to Active Listings Ratio for Detached Properties in Burnaby in December 2016 (see graph below)

Burnaby, Dec 2016: 0.169 | -69.3% (change since December 2015)

November 2016: 0.12

Burnaby housing market is still a “buyers” marker in December 2016. Huge difference when we compare to earlier this year when we had a very strong “sellers” market.

In conclusion, the housing market in Burnaby continues to be a “buyers” market. The average sales price has not gone down as compared to November of this year. In fact the average sales price has gone up. Overall we see low levels of inventory and low transaction levels. Burnaby detached housing market is “slow” heading into 2017.

If you found this article helpful leave a comment below. 

*all the information has been take form the Real Estate Board of Greater Vancouver.  

Burnaby condo market update. Everything FIRST TIME buyers NEED to KNOW – Dec 2016

burnaby condos and skytrain view

From my experience, most of the people searching for 1 bedroom condos in Burnaby BC are either first time buyers or investors.  However, you don’t have to be a first time buyer or an investor to find the information in this article useful.

We will breakdown 1 bedroom, resale (no new construction), condo and apartment units in Burnaby BC. Townhouses are not included in these graph and statistics. We will focus on November 2016 and the changes in the real estate trends over the past year. Each graph is from January 2013 to November 2016.

Lets start by looking at Average Sale Price for 1 bedroom condo in Burnaby in November 2016 (see graph below)

Burnaby: $344,681 | +17.6% (change since November 2015)

We see huge market price gains in November 2016 as compared to November 2015. There is a slight dip in prices as compared to Summer 2016. Not a big deal. Slight price variations are expected over the annual cycle of the real estate market.


Next, lets look at Average Percent of Original Price in November 2016 (see graph below)

Burnaby: 99.2% | +2.9% (change since November 2015)

Sellers in Burnaby are still getting almost full asking price for their 1 bedroom condos. 99.2% of the asking price is well above the 10 year average. This tells us that the demand for 1 bedroom condos in Burnaby is high.


Lets talk about Average Price Per Square Foot in November 2016 (see graph below)

Burnaby: $547 | +24.0% (change since November 2015)

The average price per square foot is up quite a bit since November of last year. We see record breaking numbers here.


Now, lets look at the Total Number of 1 Bedroom Condos for Sale in Burnaby in November 2016 (see graph below)

Burnaby: 50 | -71.8% (change since November 2015)

Huge drops in total inventory numbers. In fact it’s the lowest it has been since December 2007. With high buyers’ demand and record low inventory it’s likely for prices to go up even higher.


Lets take a look at the Number of New Listing on the Market next (see graph below)

Burnaby: 33 | -45.0% (change since November 2015)

Big drop in the number of new listings as compared to November 2015. However, it’s not unusual for the number of new listings to be low for this time of year.


Now, lets take a look at the Total Number of 1 Bedroom Condos Sold in November 2016 (see graph below)

Burnaby: 43 | 0.0% (change since November 2015)

We have identical number of sales as we did last November. It is well about the 10 year average for this time of year. Buyers demand for 1 bedroom condos in Burnaby is high.


Lastly, lets have a look at Sales to Active Listings Ratio in November 2016 (see graph below)

Burnaby: 0.860 | +253.9% (change since November 2015)

Huge increase in the sales to active listings ratio since November 2015. Currently Burnaby 1 bedroom condo market is a very strong “sellers” market. 8.6 out of 10 condos were sold this November.

In summery, Burnaby 1 bedroom condo market is a very strong “sellers” market. The inventory levels are very low and the demand is high. We see record breaking prices.

I hope you found this article helpful. If so, please, share it with someone who’s looking for a Burnaby condo or someone who owns a condo in Burnaby and would appreciate the extra info.

Find Burnaby condos for sale here!

*All of the statistics and graphs have been taken from Real Estate Board of Greater Vancouver.