Greater Vancouver real estate market update for April 2023


The real estate market is currently experiencing a shortage of available inventory, which is causing a decline in seller interest in listing their properties. This is primarily due to the increase in borrowing costs, which has made it difficult for sellers to qualify for the same mortgage amount as in the past. Additionally, the stress test, which determines whether borrowers can afford mortgage payments at higher interest rates, has contributed to the decrease in inventory.

As a result of the lack of available inventory, there has been a slight increase in prices, and multiple offers are becoming more common. Many buyers who have been waiting on the sidelines are now ready to enter the market, but there are not enough properties to meet the demand. While statistics may not paint the full picture, current indicators suggest that prices are unlikely to decrease and may even continue to rise slightly, which is worth noting for potential buyers.

In addition to the limited inventory in the real estate market, the rental market is also strong, particularly in Vancouver, which remains the most expensive city in Canada to rent. The average cost of a one-bedroom unit in Vancouver is $2640, while a two-bedroom unit costs $3632. Burnaby also ranks as the third most expensive city in Canada for rent, with one-bedroom units costing $2282 and two-bedroom units costing $3175.

This strong rental market can be attributed to the shortage of available properties for rent, causing demand to exceed supply, resulting in a competitive rental market. Landlords have the upper hand, and tenants often must pay a higher price for a desirable rental property. While this may not be ideal for renters, it does present opportunities for investors looking to purchase and rent out properties in these cities.

Overall, the current state of the real estate market is due to a combination of factors, including the rise in borrowing costs, the stress test, and the lack of available properties for rent. While this has led to a slight increase in prices, it is unlikely to be a dramatic change. However, those looking to buy or rent in Vancouver or Burnaby should be aware of the current state of the market and the high associated costs.

Are multiple offers back? – Greater Vancouver Real Estate Market Update March 2023

The Vancouver real estate market is experiencing a surge in multiple offer situations due to a low inventory of available properties. This trend is especially clear in a condo and the townhouse markets in Greater Vancouver. However, the current trend is different from the past as these multiple offers are much closer to the listing price. In the past, during multiple offer situations, properties would sell for 10 or even 20 percent over the listing price.

The Vancouver real estate market has been one of the hottest and most competitive markets in North America for the past several years. The city’s picturesque location and robust economy have attracted many buyers, making it difficult for many first-time homebuyers to enter the market. This situation has been exacerbated by a low inventory of available properties.

The low inventory of available properties has created a competitive environment for buyers, and as a result, multiple offer situations have become more common. In a multiple offer situation, several buyers make an offer on the same property, which can drive up the price. However, in the past, during these multiple offer situations, the price would often exceed the listing price by a significant margin.

Today, the situation is different. Buyers are still making offers on the same properties, but the offers are much closer to the listing price. This trend is likely due to several factors. Firstly, buyers are becoming more educated and savvy about the market. They are aware of the risks of overbidding and are therefore more cautious. Secondly, historically high interest rates makes it much harder to qualify for mortgages.

The shift towards more reasonable offers is a positive development for both buyers and sellers. Buyers are more likely to get the property at a fair price, while sellers can sell their property without worrying about overpricing or underpricing.

However, the competitive environment created by the low inventory of condos and townhouses is still present, and multiple offer situations are still happening. Buyers need to be prepared and do their due diligence before making an offer. They should have a good understanding of the market and the value of the property. It’s also important to work with a reputable real estate agent who can guide them through the process.

In conclusion, the Vancouver real estate market is experiencing a surge in multiple offer situations due to a low inventory of available properties. However, the current trend is different from the past as these multiple offers are much closer to the listing price. This is a positive development for both buyers and sellers and is likely due to increased education and transparency in the market. Buyers should still be prepared for a competitive environment and do their due diligence before making an offer.


What you NEED to know about Vancouver’s real estate market in February 2023


Over the past year, interest rates have surged significantly, and the average 5-year variable rate is now around 6.45%. In comparison, just a year ago, the rate was at 1.6%. The increase in interest rates has led to a considerable increase in monthly mortgage payments, where on a $400,000 mortgage, the payment has increased from $1,617 to around $2,667. As a result, the real estate market has been slowed down considerably.

In January 2023, the real estate market witnessed 55.3% fewer transactions compared to January 2022. The market was so slow that it was 42.9% slower than the ten-year average for January, which is typically a slow month for real estate transactions. The increase in interest rates has led to a considerable rise in monthly mortgage payments, making it challenging for buyers to afford new properties.

Despite the market slowdown, prices have not dropped as much as anticipated. Detached houses have seen a 9.1% decrease from January 2022, while apartments have only decreased by 1.1% since last year. More surprisingly, apartments have gone up by 1% in the last month, and there are differing opinions on what may have caused this phenomenon.

Rentals.ca reports that Vancouver remains the most expensive city in Canada for rent. The average cost of a one-bedroom unit is $2596 per month, and a two-bedroom unit rents for an average of $3562. Given these high rental prices, it is unsurprising that many people prefer to invest in the real estate market, despite the high interest rates.

Looking ahead, the Bank of Canada may be ready to pause further interest rate increases. If this happens, and the interest rate stabilizes, we might see a lot of activity in the real estate market in the spring. As a result, if you have been considering purchasing a property, this could be a good time to make a move.

In conclusion, the rise in interest rates has had a significant impact on the real estate market, slowing it down considerably. Nevertheless, it is not clear whether this trend will continue, and the market may pick up in the coming months. As a result, it is crucial to keep a close eye on the market and make informed decisions before making any significant purchases.

Real estate market update for October 2022

Let’s talk about the new September market statistics and what we can learn from them. 

The market is much slower than usual at the moment. There are fewer sales across the board. About a 35% drop in over all transactions as compared to 10 year average. This is a fairly significant slow down. 

Think about how much more real estate has been built over the last 10 years. Right now there are fewer sales even though the total number of real estate units is constantly increasing. 

How significant this impact is depends on the type of real estate we look at and the price point. 

For example detached houses have a sales to active listings ratio of about 12%.  Meaning 12 out of every 100 houses available were sold in September. As far as apartments go the situation is a quite a bit different a sales to active listings ratio is about 21%. Which is almost double of that of the detached properties. 

I think the evidence of this in my everyday work. 1 bedroom and studio units are still selling well. The demand and the prices did come down a bit but there is still a health amount of buyer activity for those starter homes. From personal experience I find the there aren’t as many speculative investors in the market right now. However buyers looking for a place to live are still active in this 1 bedroom and studio units category.   

If you are looking to sell your 1 bedroom or a studio unit are likely to receive a healthy amount of interest. 

The same can not be said for detached properties. Especially luxury market. From my experience the demand is not there and those properties take much longer to sell.

As far the prices are concern there is a drop. The board is reporting about a 2% price drop from August. I think that’s about in-line with my experience. 

The primary cause of this market slow down and the price decrease are of course higher interest rates. Bank of Canada did once again raise their benchmark interest rate in September which definitely slows down the market. 

Buyers aren’t able to borrow as much money as the stress test rate at the moment is ridiculously high. All of this creates quite a bit uncertainty for the future.

If you’re a seller my advice to be patient. And be realistic with your prices. 

If you’re a buyer be ready. Have all of your down payment and pre-approval ready. Good opportunities to pop-up on the market. But they also disappear just as quickly. You want to put yourself in a position to take advantage of such opportunities. 

I hope you will find this video helpful. Feel free to share this video with anyone who you think will find it useful. 

If you’re in the market you might be interested in my monthly real estate newsletter. Here is a link: Real Estate Insider Newsletter

Thanks for reading.

Link to Real Estate Board of Great Vancouver statistics.

Burnaby BC detached housing market update for August 2018

MLS Home Price Index

MLS Home Price Index for the detached houses in Burnaby in August 2018 (see graph below)

Burnaby East: $1,269,200 | -3.9% (change since August 2017)

Burnaby North: $1,501,200 | -5.8% (change since August 2017)

Burnaby South: $1,621,000 | -5.6% (change since August 2017)


Average Sales Price

Average Sales Price of the detached houses in Burnaby in August 2018 (see graph below)

Burnaby East: $1,384,823 | -0.4% (change since August 2017)

Burnaby North: $1,749,432 | +1.2% (change since August 2017)

Burnaby South: $1,765,238 | -2.2% (change since August 2017)


Average Percent of Original Price

Average Percent of Original Asking Price of the detached houses in Burnaby in August 2018 (see graph below)

Burnaby East: 96.1% | +0.1% (change since August 2017)

Burnaby North: 94.4% | -1.2% (change since August 2017)

Burnaby South: 90.3% | -2.9% (change since August 2017)


Total Inventory

Total Inventory of the detached houses in Burnaby in August 2018 (see graph below)

Burnaby East: 67 | -5.6% (change since August 2017)

Burnaby North: 218 | -7.2% (change since August 2017)

Burnaby South: 254 | -6.3% (change since August 2017)


New Listings

All New Listings of the detached houses in Burnaby in August 2018 (see graph below)

Burnaby East: 11 | -47.6% (change since August 2017)

Burnaby North: 53 | -30.3% (change since August 2017)

Burnaby South: 47 | -35.6% (change since August 2017)


Total Sales

Sales of the detached houses in Burnaby in August 2018 (see graph below)

Burnaby East: 7 | +75.0% (change since August 2017)

Burnaby North: 22 | -31.3% (change since August 2017)

Burnaby South: 12 | -58.6% (change since August 2017)


Sales to Actives Ratio

Sales to Active Listings Ratio of the detached houses in Burnaby in August 2018 (see graph below)

Burnaby East: 0.104 | +85.7% (change since August 2017)

Burnaby North: 0.101 | -25.7% (change since August 2017)

Burnaby South: 0.047 | -56.1% (change since August 2017)

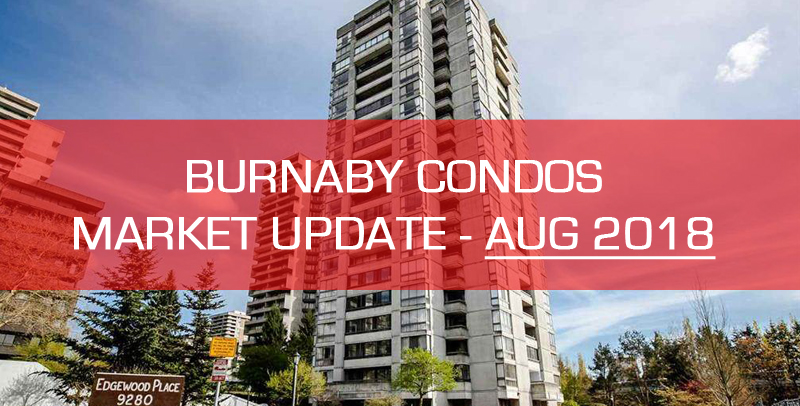
Burnaby 1 bedroom and studio condos market update for August 2018

Home Price Index

Home Price Index for condo units in Burnaby in August 2018 (see graph below)

Burnaby East: $782,800 | +6.8% (change since August 2017)

Burnaby North: $650,900 | +15.0% (change since August 2017)

Burnaby South: $717,800 | +10.9% (change since August 2017)


Average Sales Price

Average Sales Price for one bedroom and studio condo units in Burnaby in August 2018 (see graph below)

Burnaby East: $531,500 | +12.5% (change since August 2017)

Burnaby North: $470,105 | -0.2% (change since August 2017)

Burnaby South: $491,673 | +6.3% (change since August 2017)


Average Percent of Original Price

Average Percent of Original Asking Price for one bedroom and studio condo units in Burnaby in August 2018 (see graph below)

Burnaby East: 93.8% | -5.2% (change since August 2017)

Burnaby North: 98.1% | -6.7% (change since August 2017)

Burnaby South: 98.0% | -5.9% (change since August 2017)


Average Price Per Square Foot

Average Price per Square Foot for one bedroom and studio condo units in Burnaby in August 2018 (see graph below)

Burnaby East: $824 | +11.8% (change since August 2017)

Burnaby North: $723 | +2.3% (change since August 2017)

Burnaby South: $821 | +12.3% (change since August 2017)


Total Inventory

Total Inventory for one bedroom and studio condo units in Burnaby in August 2018 (see graph below)

Burnaby East: 6 | -62.5% (change since August 2017)

Burnaby North: 35 | +52.2% (change since August 2017)

Burnaby South: 77 | +75.0% (change since August 2017)


New Listings

New Listings for one bedroom and studio condo units in Burnaby in August 2018 (see graph below)

Burnaby East: 2 | -77.8% (change since August 2017)

Burnaby North: 24 | -11.1% (change since August 2017)

Burnaby South: 39 | -17.0% (change since August 2017)


Sales

Total Sales for one bedroom and studio condo units in Burnaby in August 2018 (see graph below)

Burnaby East: 2 | -50.0% (change since August 2017)

Burnaby North: 20 | -33.3% (change since August 2017)

Burnaby South: 26 | -36.6% (change since August 2017)


Sales to Actives Ratio

Sales to Active Listings Ratio for one bedroom and studio condo units in Burnaby in August 2018 (see graph below)

Burnaby East: 0.333 | +33.2% (change since August 2017)

Burnaby North: 0.571 | -56.2% (change since August 2017)

Burnaby South: 0.338 | -63.7% (change since August 2017)

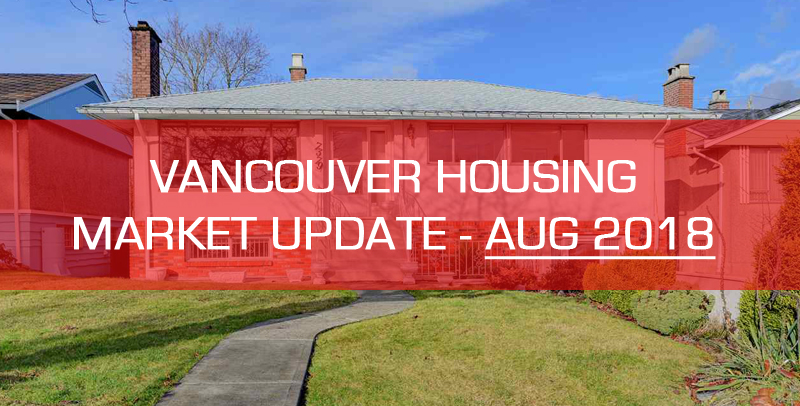
Vancouver BC housings market update for August 2018

MLS Home Price Index

MLS Home Price Index of detached houses in Vancouver BC in August 2018 (see graph below)

Vancouver East: $1,529,200 | -2.3% (change since August 2017)

Vancouver West: $3,278,500 | -10.3% (change since August 2017)


Average Sales Price

Average Sales Price of detached houses in Vancouver BC in August 2018 (see graph below)

Vancouver East: $1,595,193 | -0.4% (change since August 2017)

Vancouver West: $3,377,478 | -22.0% (change since August 2017)


Average Percent of Original Price

Average Percent of Original Asking Price of detached houses in Vancouver BC in August 2018 (see graph below)

Vancouver East: 94.9% | -2.6% (change since August 2017)

Vancouver West: 89.0% | -6.9% (change since August 2017)


Total Inventory

Total Inventory of detached houses in Vancouver BC in August 2018 (see graph below)

Vancouver East: 849 | +4.0% (change since August 2017)

Vancouver West: 821 | -2.0% (change since August 2017)


New Listings

New Listings of detached houses in Vancouver BC in August 2018 (see graph below)

Vancouver East: 172 | -17.7% (change since August 2017)

Vancouver West: 165 | -15.8% (change since August 2017)


Total Sales

Sales of detached houses in Vancouver BC in August 2018 (see graph below)

Vancouver East: 58 | -49.6% (change since August 2017)

Vancouver West: 59 | +13.5% (change since August 2017)


Sales to Actives Ratio

Sales to Active Listings Ratio of detached houses in Vancouver BC in August 2018 (see graph below)

Vancouver East: 0.068 | -51.8% (change since August 2017)

Vancouver West: 0.072 | +16.1% (change since August 2017)

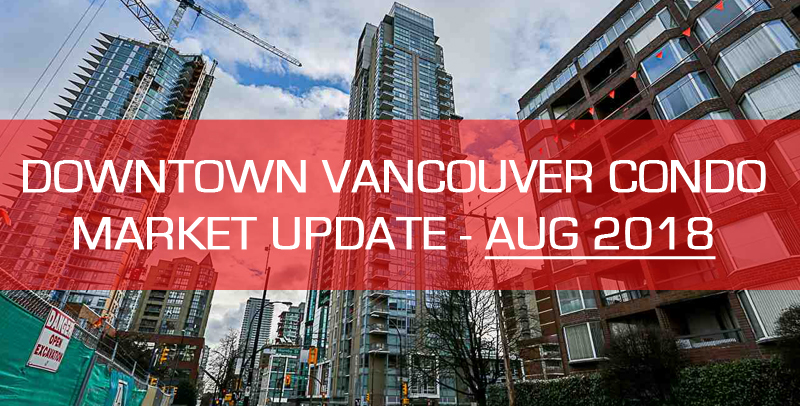
1 bedroom and studio units real estate market update for August 2018 in downtown Vancouver

Home Price Index

Home Price Index for condo units in downtown Vancouver in August 2018 (see graph below)

Coal Harbour: $1,186,300 | +17.4% (change since August 2017)

Downtown VW: $700,100 | +0.6% (change since August 2017)

West End: $667,100 | +2.5% (change since August 2017)

Yaletown: $912,700 | +6.8% (change since August 2017)


Average Sales Price

Average Sales Price of one bedroom and studio condo units in downtown Vancouver in August 2018 (see graph below)

Coal Harbour: $759,750 | +5.2% (change since August 2017)

Downtown VW: $683,508 | +4.9% (change since August 2017)

West End: $569,472 | -0.5% (change since August 2017)

Yaletown: $729,947 | -3.3% (change since August 2017)


Average Percent of Original Price

Average Percent of Original Asking Price of one bedroom and studio condo units in downtown Vancouver in August 2018 (see graph below)

Coal Harbour: 94.5% | -6.0% (change since August 2017)

Downtown VW: 97.3% | -5.5% (change since August 2017)

West End: 95.9% | -7.1% (change since August 2017)

Yaletown: 97.8% | 0.0% (change since August 2017)


Average Price Per Square Foot

Average Price Per Square Foot of one bedroom and studio condo units in downtown Vancouver in August 2018 (see graph below)

Coal Harbour: $1,200 | -0.1% (change since August 2017)

Downtown VW: $1,115 | +1.6% (change since August 2017)

West End: $907 | -6.5% (change since August 2017)

Yaletown: $1,204 | +5.1% (change since August 2017)


Total Inventory

Total Inventory of one bedroom and studio condo units in downtown Vancouver in August 2018 (see graph below)

Coal Harbour: 16 | 0.0% (change since August 2017)

Downtown VW: 118 | +81.5% (change since August 2017)

West End: 46 | +9.5% (change since August 2017)

Yaletown: 47 | +67.9% (change since August 2017)


New Listings

New Listings of one bedroom and studio condo units in downtown Vancouver in August 2018 (see graph below)

Coal Harbour: 16 | 0.0% (change since August 2017)

Downtown VW: 118 | +81.5% (change since August 2017)

West End: 46 | +9.5% (change since August 2017)

Yaletown: 47 | +67.9% (change since August 2017)


Total Sales

Sales of one bedroom and studio condo units in downtown Vancouver in August 2018 (see graph below)

Coal Harbour: 4 | -63.6% (change since August 2017)

Downtown VW: 41 | -37.9% (change since August 2017)

West End: 18 | -43.8% (change since August 2017)

Yaletown: 19 | -20.8% (change since August 2017)


Sales to Actives Ratio

Sales to Active Listings Ratio of one bedroom and studio condo units in downtown Vancouver in August 2018 (see graph below)

Coal Harbour: 0.250 | -63.7% (change since August 2017)

Downtown VW: 0.347 | -65.8% (change since August 2017)

West End: 0.391 | -48.7% (change since August 2017)

Yaletown: 0.404 | -52.9% (change since August 2017)

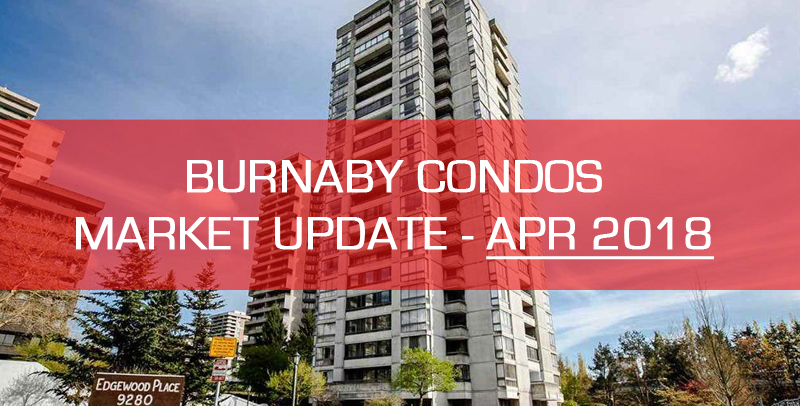
Burnaby BC 1 Bedroom and Studio Condo Units Market Update – April 2018

Average Sales Price

Average Sales Price for one bedroom and studio condo units in Burnaby in April 2018 (see graph below)

Burnaby East: $477,972 | +11.3% (change since April 2017)

Burnaby North: $515,380 | +22.4% (change since April 2017)

Burnaby South: $506,238 | +16.4% (change since April 2017)


Average Percent of Original Price

Average Percent of Original Asking Price for one bedroom and studio condo units in Burnaby in April 2018 (see graph below)

Burnaby East: 100.8% | -4.6% (change since April 2017)

Burnaby North: 104.5% | +3.0% (change since April 2017)

Burnaby South: 101.5% | -1.3% (change since April 2017)


Average Listing to Contract Days

Average Listings to Contract Days for one bedroom and studio condo units in Burnaby in April 2018 (see graph below)

Burnaby East: 12 | +33.3% (change since April 2017)

Burnaby North: 9 | -43.8% (change since April 2017)

Burnaby South: 23 | +76.9% (change since April 2017)


Average Price Per Square Foot

Average Price Per Square Foot for one bedroom and studio condo units in Burnaby in April 2018 (see graph below)

Burnaby East: $840 | +27.1% (change since April 2017)

Burnaby North: $782 | +24.1% (change since April 2017)

Burnaby South: $802 | +18.3% (change since April 2017)


Total Inventory

Total Inventory of one bedroom and studio condo units in Burnaby in April 2018 (see graph below)

Burnaby East: 4 | -60.0% (change since April 2017)

Burnaby North: 26 | -21.2% (change since April 2017)

Burnaby South: 38 | +18.8% (change since April 2017)


New Listings

New Listings of one bedroom and studio condo units in Burnaby in April 2018 (see graph below)

Burnaby East: 4 | -33.3% (change since April 2017)

Burnaby North: 34 | -5.6% (change since April 2017)

Burnaby South: 41 | +5.1% (change since April 2017)


Sales

Total Sales of one bedroom and studio condo units in Burnaby in April 2018 (see graph below)

Burnaby East: 6 | +20.0% (change since April 2017)

Burnaby North: 25 | -21.9% (change since April 2017)

Burnaby South: 21 | -46.2% (change since April 2017)


Sales to Actives Ratio

Sales to Active Listings Ratio for one bedroom and studio condo units in Burnaby in April 2018 (see graph below)

Burnaby East: 1.500 | +200.0% (change since April 2017)

Burnaby North: 0.962 | -0.8% (change since April 2017)

Burnaby South: 0.553 | -53.2% (change since April 2017)

Burnaby Detached Housing Market Real Estate Update – April 2018

MLS Home Price Index

MLS Home Price Index for the detached houses in Burnaby in April 2018 (see graph below)

Burnaby East: $1,331,300 | +11.0% (change since April 2017)

Burnaby North: $1,595,800 | +4.5% (change since April 2017)

Burnaby South: $1,675,800 | +2.7% (change since April 2017)


Average Sales Price

Average Sales Price of the detached houses in Burnaby in April 2018 (see graph below)

Burnaby East: $1,564,000 | +1.7% (change since April 2017)

Burnaby North: $1,701,965 | +0.4% (change since April 2017)

Burnaby South: $1,721,767 | -2.6% (change since April 2017)


Average Percent of Original Price

Average Percent of Original Asking Price of the detached houses in Burnaby in April 2018 (see graph below)

Burnaby East: 94.5% | -2.7% (change since April 2017)

Burnaby North: 97.3% | -0.7% (change since April 2017)

Burnaby South: 96.8% | -0.4% (change since April 2017)


Average Listing to Contract Days

Average Number of Days on the Market of the detached houses in Burnaby in April 2018 (see graph below)

Burnaby East: 36 | -18.2% (change since April 2017)

Burnaby North: 21 | -22.2% (change since April 2017)

Burnaby South: 25 | -39.0% (change since April 2017)


Total Inventory

Total Inventory of the detached houses in Burnaby in April 2018 (see graph below)

Burnaby East: 71 | +51.1% (change since April 2017)

Burnaby North: 224 | +28.7% (change since April 2017)

Burnaby South: 240 | +11.6% (change since April 2017)


New Listings

New Listings of the detached houses in Burnaby in April 2018 (see graph below)

Burnaby East: 29 | +16.0% (change since April 2017)

Burnaby North: 106 | +32.5% (change since April 2017)

Burnaby South: 103 | +25.6% (change since April 2017)


Total Sales

Sales of the detached houses in Burnaby in April 2018 (see graph below)

Burnaby East: 10 | -52.4% (change since April 2017)

Burnaby North: 26 | -50.0% (change since April 2017)

Burnaby South: 18 | -41.9% (change since April 2017)


Sales to Actives Ratio

Sales to Active Listings Ratio for the detached houses in Burnaby in April 2018 (see graph below)

Burnaby East: 0.141 | -68.5% (change since April 2017)

Burnaby North: 0.116 | -61.2% (change since April 2017)

Burnaby South: 0.075 | -47.9% (change since April 2017)