Burnaby Housing Market Real Estate Update – June 2017

burnaby housing market update

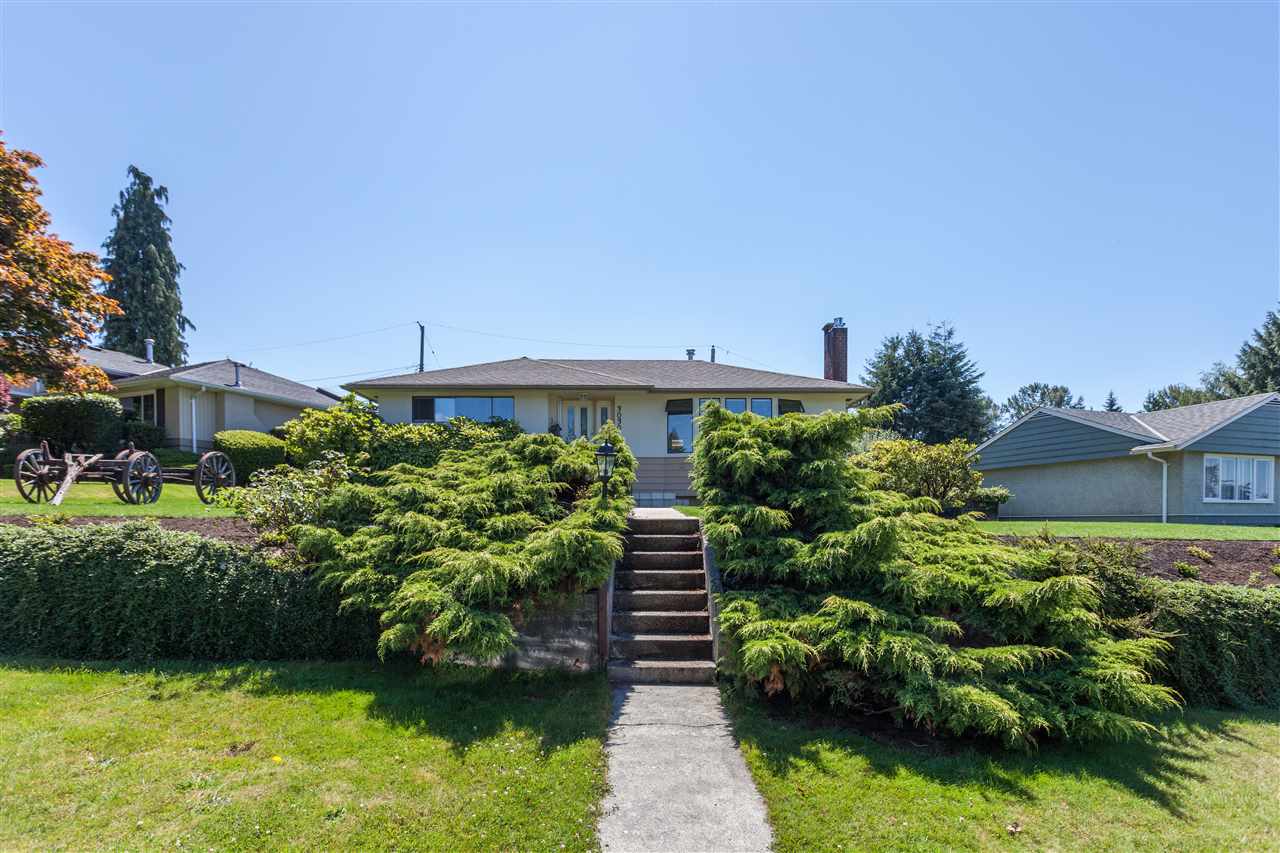
Here is a real estate update of Burnaby housing market for June 2017. We will look at detached market only. Condos and townhouses have their own market update in a separate blog post. We will only look at resale homes (no new construction).

Average Sales Price

Average Sales Price of detached house in Burnaby in June 2017 (see graph below)

Burnaby East: $1,634,000 | +12.6% (change since June 2016)

Burnaby North: $1,737,458 | -3.6% (change since June 2016)

Burnaby South: $1,846,264 | +4.6% (change since June 2016)


Average Percent of Original Asking Price

Average Percent of Original Price of houses in Burnaby in June 2017 (see graph below)

Burnaby East: 99.6% | -3.2% (change since June 2016)

Burnaby North: 97.3% | -3.4% (change since June 2016)

Burnaby South: 98.8% | -5.4% (change since June 2016)


Total Inventory

Total inventory of detached houses in Burnaby in June 2017 (see graph below)

Burnaby East: 58 | 0.0% (change since June 2016)

Burnaby North: 177 | +13.5% (change since June 2016)

Burnaby South: 224 | +15.5% (change since June 2016)


New Listings

Total number of New Listings of detached houses in Burnaby in June 2017 (see graph below)

Burnaby East: 28 | -15.2% (change since June 2016)

Burnaby North: 101 | +6.3% (change since June 2016)

Burnaby South: 107 | 0.0% (change since June 2016)


Sales

Total Sales of detached houses in Burnaby in June 2017 (see graph below)

Burnaby East:  9 | -55.0% (change since June 2016)

Burnaby North: 43 | -8.5% (change since June 2016)

Burnaby South: 46 | -8.0% (change since June 2016)


Sales to Active Listings Ratio

Sales to Active Listings Ratio of detached houses in Burnaby in June 2017 (see graph below)

Burnaby East:  0.155 | -55.1% (change since June 2016)

Burnaby North: 0.243 | -19.3% (change since June 2016)

Burnaby South: 0.205 | -20.5% (change since June 2016)

In conclusion, Burnaby detached housing market is a little slower than it was at this time last year. Average sale price prices remain strong. Average sale price of detached houses in Burnaby East is at it’s all time high. We see healthy inventory levels in all the Burnaby areas. Total number of sales is about the same as June 2016.  Based on the Sales to Active Listings Ration all three Burnaby areas are in a balanced market with a slight favourability of sellers.

Vancouver Downtown Condo Market Update – June 2017

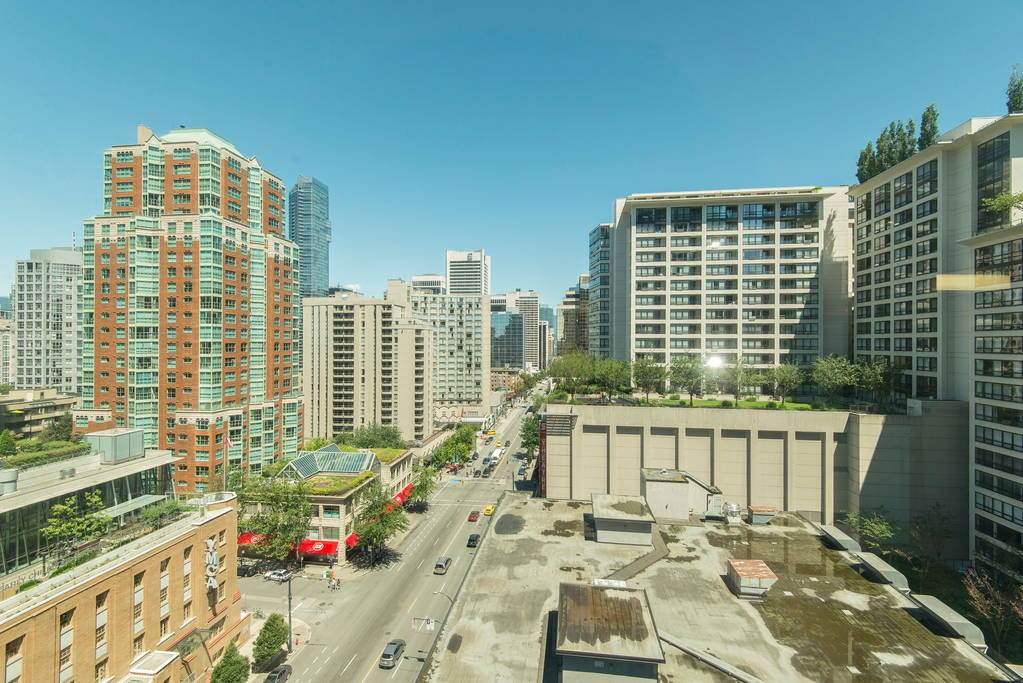
Downtown Vancouver has experienced high levels of market activity over the last couple of months. Price increases, high sales to active listings ratio and low inventory levels.

Here is a detailed breakdown of Downtown Vancouver condo market for June 2017. Only resale real estate is accounted for. The statistics below represent one bedroom and studio condo units.

Average Sales Price

Average Sales Price of ONE bedroom condo units in downtown Vancouver in June 2017 (see graph below)

Coal Harbour: $867,889 | +5.3% (change since June 2016)

Downtown VW: $655,465 | +15.2% (change since June 2016)

West End: $600,197 | +9.3% (change since June 2016)

Yaletown: $711,028 | +13.1% (change since June 2016)


Average Percent of Original Price

Average Percent of Original Asking Price for ONE bedroom condo units in downtown Vancouver in June 2017 (see graph below)

Coal Harbour: 105.2% | -0.8% (change since June 2016)

Downtown VW: 104.0% | -1.9% (change since June 2016)

West End: 103.7% | -4.1% (change since June 2016)

Yaletown: 101.1% | -4.1% (change since June 2016)


Average Price Per Square Foot

Average Price Per Square Foot for ONE bedroom condo units in downtown Vancouver in June 2017 (see graph below)

Coal Harbour: $1,270 | +13.2% (change since June 2016)

Downtown VW: $1,065 | +15.1% (change since June 2016)

West End: $991 | +17.6% (change since June 2016)

Yaletown: $1,096 | +11.3% (change since June 2016)


Total Inventory

Total Inventory of ONE bedroom condo units for sale in downtown Vancouver in June 2017 (see graph below)

Coal Harbour: 12 | -14.3% (change since June 2016)

Downtown VW: 51 | -22.7% (change since June 2016)

West End: 32 | +14.3% (change since June 2016)

Yaletown: 22 | -42.1% (change since June 2016)


New Listings

New Listings of ONE bedroom condo units for sale in downtown Vancouver in June 2017 (see graph below)

Coal Harbour: 9 | -25.0% (change since June 2016)

Downtown VW: 76 | -23.2% (change since June 2016)

West End: 29 | +3.6% (change since June 2016)

Yaletown: 24 | -51.0% (change since June 2016)


Total Sales

Number of Sales of ONE bedroom condo units in downtown Vancouver in June 2017 (see graph below)

Coal Harbour: 9 | 0.0% (change since June 2016)

Downtown VW: 65 | -30.9% (change since June 2016)

West End: 18 | -35.7% (change since June 2016)

Yaletown: 25 | -44.4% (change since June 2016)


Sales to Actives Ratio

Number of Sales of ONE bedroom condo units in downtown Vancouver in June 2017 (see graph below)

Coal Harbour: 0.750 | +16.6% (change since June 2016)

Downtown VW: 1.275 | -10.5% (change since June 2016)

West End: 0.563 | -43.7% (change since June 2016)

Yaletown: 1.136 | -4.1% (change since June 2016)

In conclusion, all of Vancouver Downtown neighbourhoods are very active. Condos are selling for over the asking price with multiple offers. Prices have increased since last year. The inventory levels decreased as compared to last year June, which already had record low inventory levels.

Downtown Vancouver Condos Market Update – March 2017

March was a busy months for the downtown condo market. Here is a detailed breakdown. Let’s take a look at 1 and 2 bedroom resale condo market. No townhouses; no new construction. All graphs go back 3 years.

Average Sales Price

Average Sales Price of ONE bedroom condo units in downtown Vancouver in March 2017 (see graph below)

Coal Harbour: $680,250 | -3.0% (change since March 2016)

Downtown VW: $555,303 | +10.1% (change since March 2016)

West End: $532,850 | +22.3% (change since March 2016)

Yaletown: $661,967 | +13.5% (change since March 2016)


Average Sales Price of TWO bedroom condo units in downtown Vancouver in March 2017 (see graph below)

Coal Harbour: $1,592,200 | -14.0% (change since March 2016)

Downtown VW: $950,038 | +10.8% (change since March 2016)

West End: $931,133 | -8.0% (change since March 2016)

Yaletown: $1,217,538 | -0.3% (change since March 2016)


Average Percent of Original Price

Average Percent of Original Asking Price for ONE bedroom condo units in downtown Vancouver in March 2017 (see graph below)

Coal Harbour: 98.7% | -4.2% (change since March 2016)

Downtown VW: 100.5% | -3.7% (change since March 2016)

West End: 103.3% | +0.6% (change since March 2016)

Yaletown: 101.8% | -3.8% (change since March 2016)

Average Percent of Original Asking Price for TWO bedroom condo units in downtown Vancouver in March 2017 (see graph below)

Coal Harbour: 101.2% | +3.3% (change since March 2016)

Downtown VW: 99.0% | -4.1% (change since March 2016)

West End: 100.0% | -1.4% (change since March 2016)

Yaletown: 100.9% | -0.5% (change since March 2016)


Average Price Per Square Foot

Average Price Per Square Foot for ONE bedroom condo units in downtown Vancouver in March 2017 (see graph below)

Coal Harbour: $1,113 | +13.5% (change since March 2016)

Downtown VW: $940 | +14.1% (change since March 2016)

West End: $905 | +24.0% (change since March 2016)

Yaletown: $1,037 | +16.9% (change since March 2016)

Average Price Per Square Foot for TWO bedroom condo units in downtown Vancouver in March 2017 (see graph below)

Coal Harbour: $1,480 | +15.4% (change since March 2016)

Downtown VW: $1,010 | +16.6% (change since March 2016)

West End: $938 | +4.5% (change since March 2016)

Yaletown: $1,142 | +6.0% (change since March 2016)


Total Inventory

Total Inventory of ONE bedroom condo units for sale in downtown Vancouver in March 2017 (see graph below)

Coal Harbour: 11 | +22.2% (change since March 2016)

Downtown VW: 59 | -15.7% (change since March 2016)

West End: 23 | -17.9% (change since March 2016)

Yaletown: 29 | +52.6% (change since March 2016)


Total Inventory of TWO bedroom condo units for sale in downtown Vancouver in March 2017 (see graph below)

Coal Harbour: 38 | +65.2% (change since March 2016)

Downtown VW: 51 | -5.6% (change since March 2016)

West End: 32 | -22.0% (change since March 2016)

Yaletown: 46 | +27.8% (change since March 2016)


New Listings

New Listings of ONE bedroom condo units for sale in downtown Vancouver in March 2017 (see graph below)

Coal Harbour: 12 | 0.0% (change since March 2016)

Downtown VW: 62 | -46.6% (change since March 2016)

West End: 31 | +3.3% (change since March 2016)

Yaletown: 38 | -2.6% (change since March 2016)


New Listings of TWO bedroom condo units for sale in downtown Vancouver in March 2017 (see graph below)

Coal Harbour: 25 | +66.7% (change since March 2016)

Downtown VW: 43 | -29.5% (change since March 2016)

West End: 24 | -38.5% (change since March 2016)

Yaletown: 42 | +10.5% (change since March 2016)


Total Sales

Number of Sales of ONE bedroom condo units in downtown Vancouver in March 2017 (see graph below)

Coal Harbour: 12 | 0.0% (change since March 2016)

Downtown VW: 58 | -44.8% (change since March 2016)

West End: 29 | -31.0% (change since March 2016)

Yaletown: 30 | -25.0% (change since March 2016)


Number of Sales of TWO bedroom condo units in downtown Vancouver in March 2017 (see graph below)

Coal Harbour: 5 | -77.3% (change since March 2016)

Downtown VW: 39 | -25.0% (change since March 2016)

West End: 18 | -56.1% (change since March 2016)

Yaletown: 39 | +5.4% (change since March 2016)


Sales to Actives Ratio

Number of Sales of ONE bedroom condo units in downtown Vancouver in March 2017 (see graph below)

Coal Harbour: 1.091 | -18.2% (change since March 2016)

Downtown VW: 0.983 | -34.5% (change since March 2016)

West End: 1.261 | -15.9% (change since March 2016)

Yaletown: 1.034 | -50.9% (change since March 2016)

Number of Sales of TWO bedroom condo units in downtown Vancouver in March 2017 (see graph below)

Coal Harbour: 0.132 | -86.2% (change since March 2016)

Downtown VW: 0.765 | -20.6% (change since March 2016)

West End: 0.563 | -43.7% (change since March 2016)

Yaletown: 0.848 | -17.5% (change since March 2016)

In conclusion, downtown condo market is still very active. On average one bedroom units are selling for over the asking price with multiple offers. The prices for two bedroom units continue “treading water”. We see low inventory levels for both 1 and 2 bedroom units. Overall the market in downtown Vancouver is active this spring season.
Burnaby BC Condo Market Update – February 2017

Here is a detailed breakdown of Burnaby BC condo market for February 2017. We will look at both 1 and 2 bedroom units. Townhouses and detached properties are not included in the statistics. Only resale properties are accounted for; no new construction.

Average Sales Price for 1 Bedroom Condos in Burnaby in February 2017 (see graph below)

February 2017: $373,057 | +17.3% (change since February 2017)

Average Sales Price for 2 Bedroom Condos in Burnaby in February 2017 (see graph below)

February 2017: $571,335 | +20.6% (change since February 2017)


Average Percent of Original Price for 1 Bedroom Condos in Burnaby in February 2017 (see graph below)

February 2017: 99.8% | +1.8% (change since February 2017)


Average Percent of Original Price for 2 Bedroom Condos in Burnaby in February 2017 (see graph below)

February 2017: 99.9% | +0.9% (change since February 2017)


Average Price Per Square Foot for 1 Bedroom Condos in Burnaby in February 2017 (see graph below)

February 2017: $582 | +13.9% (change since February 2017)

Average Price Per Square Foot for 2 Bedroom Condos in Burnaby in February 2017 (see graph below)

February 2017: $576 | +13.8% (change since February 2017)


Total Inventory of 1 Bedroom Condos in Burnaby in February 2017 (see graph below)

February 2017: 61 | -46.0% (change since February 2017)

Total Inventory of 2 Bedroom Condos in Burnaby in February 2017 (see graph below)

February 2017: 136 | -40.4% (change since February 2017)


New listings of 1 Bedroom Condos in Burnaby in February 2017 (see graph below)

February 2017: 55 | -20.3% (change since February 2017)

New listings of 2 Bedroom Condos in Burnaby in February 2017 (see graph below)

February 2017: $388,204 | +25.5% (change since February 2017)


Total Sales of 1 Bedroom Condos in Burnaby in February 2017 (see graph below)

February 2017: 40 | -42.0% (change since February 2017)

Total Sales of 2 Bedroom Condos in Burnaby in February 2017 (see graph below)

February 2017: 72 | -36.8% (change since February 2017)


Sales to Active Listings Ratio of 1 Bedroom Condos in Burnaby in February 2017 (see graph below)

February 2017: 0.656 | +7.4% (change since February 2017)

Sales to Active Listings Ratio of 2 Bedroom Condos in Burnaby in February 2017 (see graph below)

February 2017: 0.529 | +5.8% (change since February 2017)


In conclusion, Burnaby condo market is still a very strong sellers market. We see a very strong buyer demand for both 1 and 2 bedroom units. Low inventory demand and hight buyer demand are driving the market. Many condos are still selling with multiple offers and over the asking price.

What you need to know about Burnaby housing market – February 2017

Here is a detailed breakdown of Burnaby BC housing market for February 2017. We will only look at resale detached houses; no new construction; no townhouses.

Average Sales Price of Houses in Burnaby in February 2017 and for the past 3 years (see graph below)

Burnaby: $1,634,617 | +0.2% (change since February 2016)

January 2017: $1,498,939

There is a slight improvement in the average sales price as compared to January 2017. However, it’s to early to tell.

Average Percent of Original Asking Price for houses in Burnaby in February 2017 and for the past 3 years (see graph below)

Burnaby: 95.9% | -11.6% (change since February 2016)

January 2017: 90.8%

On average houses were sold for about 4-5% under the original asking price.

Average Amount of Time it Took to Sell a House in Burnaby  in February 2017 and for the past 3 years (see graph below)

Burnaby: 39 | +143.8% (change since February 2016)

January 2017: 68

Average length of time for the sale of a detached house in Burnaby was just over a month. That number is consistent with what we’ve seen over the last 10 years.

Total Inventory of Houses for Sale in Burnaby in February 2017 and for the past 3 years (see graph below)

Burnaby: 373 | +47.4% (change since February 2016)

January 2017: 344

We are reaching the 10 year inventory average for this season. Last year there were unusually low levels of inventory.

New Listings of Houses for Sale in Burnaby BC in February 2017 and for the past 3 years (see graph below)

Burnaby: 139 | -41.4% (change since February 2016)

January 2017: 160

Total Sales in February 2017 and for the past 3 years (see graph below)

Burnaby: 48 | -66.0% (change since February 2016)

January 2017: 39

The total sales are still lower than the 10 year average.

Sales to Active Listings Ratio in February 2017 and for the past 3 years (see graph below)

Burnaby: 0.129 | -76.8% (change since February 2016)

January 2017: 0.11

Based on the sales to active listings ratio Burnaby housing market is currently “balanced” market. However, it’s very close to being a “buyers market”.

In conclusion, Burnaby housing market is a balanced market with average inventory levels. The average sales price over the last few months has been about the same.

Vancouver Housing Real Estate Market Update – February 2017

Here is a detailed real estate market update for detached houses in Vancouver BC. We will only focus on detached housing market; no townhouses or condo units are included. In this market update we will only discuss resale houses; new construction houses are excluded.

Average Sale Price of detached houses in Vancouver in February 2017 (see graph below)

Vancouver East: $1,488,371 | -2.8% (change since February 2016)

Vancouver West: $3,704,774 | -0.3% (change since February 2016)

The average sales price in both Vancouver East and Vancouver West are is lower than the same time last year. However, there is a slight improvement as compared to January 2017.


Average Percent of Original Price of detached houses in Vancouver in February 2017 (see graph below)

Vancouver East: 96.9% | -8.8% (change since February 2016)

Vancouver West: 95.9% | -7.8% (change since February 2016)

Houses are selling about 4-5% under the original asking price. A bit lower than usual.


Total Inventory of detached houses in Vancouver in February 2017 (see graph below)

Vancouver East: 634 | +80.6% (change since February 2016)

Vancouver West: 568 | -2.4% (change since February 2016)

We are experiencing a little higher than usual inventory levels for this season.


Number of New Listings of detached houses in Vancouver in February 2017 (see graph below)

Vancouver East: 170 | -29.8% (change since February 2016)

Vancouver West: 163 | -57.2% (change since February 2016)

The number of new listings in February 2017 was a bit low for the season. That’s good news for the sellers as inventory levels are still a little high. Limited number of new listings could tip the scale in the favour of sellers in the upcoming months.


Total Number of Sales of detached houses in Vancouver in February 2017 (see graph below)

Vancouver East: 82 | -46.8% (change since February 2016)

Vancouver West: 92 | -56.8% (change since February 2016)

Sales of detached houses in Vancouver in February 2017 were lower than usual for the season.


Sales to Active Listings Ratio for the detached houses in Vancouver in February 2017 (see graph below)

Vancouver East: 0.129 | -70.6% (change since February 2016)

Vancouver West: 0.162 | -55.7% (change since February 2016)

Based on sales to actives ratio data, Vancouver detached housing market is still a buyers market.

In conclusion, the prices of detached properties in Vancouver have increased since January 2017. However the prices as compared to the same time last year are down. We are still in the buyers market with properties selling 4-5% under the original asking price. Inventory levels are a little high, but they are levelling off because of the limited supply of new listings.

Downtown Vancouver Condo Market Real Estate Update – February 2017

Here is a look at the Downtown Vancouver condo market in February 2017. We will be looking at resale condo units only. No townhouses; no new construction. This real estate update will focus on one bedroom and two bedroom condo units separately. All graphs are for the past 3 years.

Average Sales Price of one bedroom condo units in downtown Vancouver in February 2017 (see graph below)

Coal Harbour: $703,091 | +0.7% (change since February 2016)

Downtown VW: $546,065 | +6.6% (change since February 2016)

West End: $493,580 | +16.9% (change since February 2016)

Yaletown: $627,750 | +16.5% (change since February 2016)

Average Sales Price of Two bedroom condo units in downtown Vancouver in February 2017 (see graph below)

Coal Harbour: $1,394,667 | +2.7% (change since February 2016)

Downtown VW: $1,007,063 | +1.9% (change since February 2016)

West End: $1,318,824 | +45.4% (change since February 2016)

Yaletown: $1,216,676 | +18.9% (change since February 2016)


Average Percent to Original Price one bedroom condos in downtown Vancouver sold for in February 2017 (see graph below)

Coal Harbour: 99.1% | -2.4% (change since February 2016)

Downtown VW: 101.0% | -3.7% (change since February 2016)

West End: 100.2% | -2.3% (change since February 2016)

Yaletown: 99.7% | -5.2% (change since February 2016)

Average Percent to Original Price two bedroom condos in downtown Vancouver sold for in February 2017 (see graph below)

Coal Harbour: 97.9% | -1.8% (change since February 2016)

Downtown VW: 98.4% | -3.4% (change since February 2016)

West End: 98.7% | -3.4% (change since February 2016)

Yaletown: 97.4% | -5.9% (change since February 2016)


Average Price Per Square Foot for One bedroom condos in downtown Vancouver in February 2017 (see graph below)

Coal Harbour: $1,034 | +8.0% (change since February 2016)

Downtown VW: $931 | +12.8% (change since February 2016)

West End: $837 | +26.6% (change since February 2016)

Yaletown: $1,097 | +24.7% (change since February 2016)

Average Price Per Square Foot for Two bedroom condos in downtown Vancouver in February 2017 (see graph below)

Coal Harbour: $1,303 | +17.2% (change since February 2016)

Downtown VW: $1,011 | +8.5% (change since February 2016)

West End: $1,052 | +24.3% (change since February 2016)

Yaletown: $1,115 | +17.6% (change since February 2016)


Total Inventory of One bedroom condos in downtown Vancouver in February 2017 (see graph below)

Coal Harbour: 14 | +55.6% (change since February 2016)

Downtown VW: 63 | -1.6% (change since February 2016)

West End: 27 | -37.2% (change since February 2016)

Yaletown: 32 | +60.0% (change since February 2016)

Total Inventory of Two bedroom condos in downtown Vancouver in February 2017 (see graph below)

Coal Harbour: 24 | -27.3% (change since February 2016)

Downtown VW: 59 | +9.3% (change since February 2016)

West End: 32 | -30.4% (change since February 2016)

Yaletown: 49 | +22.5% (change since February 2016)


New Listings of One bedroom condos in downtown Vancouver in February 2017 (see graph below)

Coal Harbour: 12 | +33.3% (change since February 2016)

Downtown VW: 56 | -44.0% (change since February 2016)

West End: 31 | -26.2% (change since February 2016)

Yaletown: 33 | -8.3% (change since February 2016)


New Listings of Two bedroom condos in downtown Vancouver in February 2017 (see graph below)

Coal Harbour: 10 | -37.5% (change since February 2016)

Downtown VW: 31 | -53.7% (change since February 2016)

West End: 16 | -61.0% (change since February 2016)

Yaletown: 40 | 0.0% (change since February 2016)


Total Sales of One bedroom condos in downtown Vancouver in February 2017 (see graph below)

Coal Harbour: 11 | -21.4% (change since February 2016)

Downtown VW: 52 | -40.9% (change since February 2016)

West End: 30 | -3.2% (change since February 2016)

Yaletown: 28 | +7.7% (change since February 2016)

Total Sales of Two bedroom condos in downtown Vancouver in February 2017 (see graph below)

Coal Harbour: 12 | -33.3% (change since February 2016)

Downtown VW: 30 | -36.2% (change since February 2016)

West End: 17 | -37.0% (change since February 2016)

Yaletown: 25 | -30.6% (change since February 2016)


Sales to Active Listings Ratio for One bedroom condos in downtown Vancouver in February 2017 (see graph below)

Coal Harbour: 0.786 | -49.5% (change since February 2016)

Downtown VW: 0.825 | -40.0% (change since February 2016)

West End: 1.111 | +54.1% (change since February 2016)

Yaletown: 0.875 | -32.7% (change since February 2016)

Sales to Active Listings Ratio for Two bedroom condos in downtown Vancouver in February 2017 (see graph below)

Coal Harbour: 0.500 | -8.3% (change since February 2016)

Downtown VW: 0.508 | -41.6% (change since February 2016)

West End: 0.531 | -9.5% (change since February 2016)

Yaletown: 0.510 | -43.3% (change since February 2016)


In conclusion, prices for both one and two bedroom condos are up across all four downtown neighbourhoods. The inventory is still at very low levels. One bedroom condo market as well as two bedroom condo market in downtown are seller markets.

Vancouver Detached Housing Market Update – January 2017

vancouver west house

Here is a detailed real estate market breakdown for detached properties. We will look at both East Vancouver and Vancouver Westside. In this real estate update we will concentrate on detached resale properties only. New construction homes as well as townhouses are excluded.

Average Sale Price of detached houses in Vancouver in January 2017 (see graph below)

Vancouver East: $1,393,547 | -7.1% (change since January 2016)

Vancouver West: $3,442,782 | -9.3% (change since January 2016)

 The average sales price of detached properties has been declining since early fall of 2016. However, January 2017 was the first month that the average sales price is lower than a year prior. Both Vancouver East and Vancouver West have lower average sales price as compared to January 2016.


Average Percent of Original Asking Price for the detached houses in Vancouver in January 2017 (see graph below)

Vancouver East: 96.0% | -6.9% (change since January 2016)

Vancouver West: 95.4% | -6.8% (change since January 2016)

Vancouver home sellers in January were selling their houses for 4-6 per cent under the original asking price. It is not unusual for properties to be selling under the asking price.


Total Inventory of detached houses for sale in Vancouver in January 2017 (see graph below)

Vancouver East: 597 | +90.7% (change since January 2016)

Vancouver West: 564 | +13.9% (change since January 2016)

There was more available inventory on the market this January as compared to the past years. Vancouver East has had exceptionally high inventory levels this January.


New Listings of detached houses for sale in Vancouver in January 2017 (see graph below)

Vancouver East: 204 | +1.5% (change since January 2016)

Vancouver West: 287 | -5.9% (change since January 2016)

It is not unusual for January to have lower number of new listings on the market as compared to the rest of the year.


Total Sales of detached houses in Vancouver in January 2017 (see graph below)

Vancouver East: 51 | -46.9% (change since January 2016)

Vancouver West: 36 | -72.5% (change since January 2016)

There were very few sales in January 2017. Some of the lowest sales numbers we’ve seen in a long time.


Sales to Active Listings Ratio of detached houses in Vancouver in January 2017 (see graph below)

Vancouver East: 0.085 | -72.3% (change since January 2016)

Vancouver West: 0.064 | -75.8% (change since January 2016)

Based on sales to active listings ratio Vancouver housing market is a strong buyers market. There is more available inventory than there are active buyers.

In conclusion, the prices have dipped about 8% as compared to January 2016. Vancouver housing market remains a strong buyers market with high inventory levels, especially in East Vancouver.

Burnaby Housing Market Update – January 2017

detached house in burnaby

Here is a first look at Burnaby housing market at the beginning of 2017. We will focus on detached housing market in January 2017. New construction homes are not accounted for. Townhouses and condos are also excluded from the statistics. You can see one bedroom condo market breakdown here.

Average Sales Price for detached houses in Burnaby in January 2017 (see graph below)

January 2017: $1,498,939 | -2.0% (change since January 2016)

December 2016: $1,591,140

The average sale price for detached properties in Burnaby has not changed much in the last few months. Since the end of summer of 2016 we’ve seen housing prices decline quite a bit. We see a slight decline in the prices in January 2017.


Average Percent of Original Asking Price for detached houses in Burnaby in January 2017 (see graph below)

January 2017: 90.8% | -14.3% (change since January 2016)

December 2016: 93.5%

Home sellers in Burnaby were selling their homes for about 10% under their original asking price. Quite a shift from spring and summer when homes were selling for close to 10% over the asking price.


Total Inventory of detached houses in Burnaby for sale in January 2017 (see graph below)

January 2017: 319 | +59.5% (change since January 2016)

December 2016: 278

Unlike Burnaby condo market, Burnaby housing market has a healthy amount of available inventory. We’ve seen a drop in the inventory levels in December 2016. Now a lot of the same listings are going back on sale.


Number of New Listings of detached houses in Burnaby for sale in January 2017 (see graph below)

January 2017: 161 | +3.9% (change since January 2016)

December 2016: 39

Number of the new listings in January is usually relatively low. However, there were quite a few new listings on the market this January.


Total Number of detached houses in Burnaby sold in January 2017 (see graph below)

January 2017: 39 | -57.1% (change since January 2016)

December 2016: 40

We had good levels of inventory but the sales of detached houses in Burnaby this January were low.  The buyer demand for detached houses has slowed significantly.


Sales to Active Listings Ratio for detached houses in Burnaby in January 2017 (see graph below)

January 2017: 0.122 | -73.2% (change since January 2016)

December 2016: 0.14

Based on sales to active listings ratio Burnaby detached housing market in January was a buyers market.

In conclusion, prices have levelled off. Inventory levels are increasing but the buyer demand is not. The next few months will be very important for the Burnaby housing market. If we don’t see more buyer demand prices might go down even farther.

Burnaby One Bedroom Condo Market Update – January 2017

burnaby condos view

Here is a first look at the one bedroom condo market in Burnaby BC in January 2017. Let’s take a look at market statistics for one bedroom and studio units (no townhouses). Brand new construction is excluded from the statistics. We will only be looking at resale units.

Average Sales Price for 1 Bedroom Condos in Burnaby in January 2017 (see graph below)

January 2017: $388,204 | +25.5% (change since January 2016)

December 2016: $357,435

Prices continue going up for 1 bedroom condos in Burnaby. The one bedroom market is primarily driven by the first-time buyers. Vancouver prices have gone up beyond the comfort level for a lot of first-time buyers and a lot the buyers have concentrated their search in Burnaby.


Average Percent of the Original Asking Price for 1 Bedroom Condos in Burnaby in January 2017 (see graph below)

January 2017: 99.2% | +2.2% (change since January 2016)

December 2016: 97.8%

Sellers of one bedroom units in Burnaby are getting almost 100% of their original asking price. I’ve seen a lot of buyer demand this past month and a lot of units getting multiple offers. 


Average Price Per Square Foot for 1 Bedroom Condos in Burnaby in January 2017 (see graph below)

January 2017: $610 | +27.3% (change since January 2016)

December 2016: $537

Average price per square foot continues going up. We’ve seen a huge increase in the pricing as compared to January of last year. We also see a big increase as compared to 2 months ago (December 2016).


Total Inventory of One Bedroom Condos in Burnaby in January 2017 (see graph below)

January 2017: 51 | -58.5% (change since January 2016)

December 2016: 36

In January 2017 we’ve seen less than half of the available inventory of January 2016. One bedroom units in Burnaby this January were scarce, although an improvement over December 2016.


Total Number of New Listings of One Bedroom Condos in Burnaby in January 2017 (see graph below)

January 2017: 43 | -39.4% (change since January 2016)

December 2016: 18

We’ve have seen a little bit more new inventory on the market this January than we did in December 2016. However, the number of new listings on the market was very low. Nowhere near enough to satisfy current levels of buyer demand.


Total Sales for 1 Bedroom Condos in Burnaby in January 2017 (see graph below)

January 2017: 24 | -52.9% (change since January 2016)

December 2016: 21

Due to low the inventory levels we’ve seen very few sales of one bedroom condos in Burnaby last month.


Total Sales for 1 Bedroom Condos in Burnaby in January 2017 (see graph below)

January 2017: 0.471 | +13.5% (change since January 2016)

December 2016: 0.54

Not surprisingly one bedroom condo market in Burnaby remains a very strong sellers market. A lot of units have received multiple offers in January 2017.

In conclusion, prices of one bedroom condos in Burnaby continue going up in price. We still see “bidding wars” on some units. One bedroom condo real estate market continues being a strong sellers market. More inventory would definitely bring a little bit of balance to the real estate market and satisfy current buyer demand. Overall a great start for 2017.